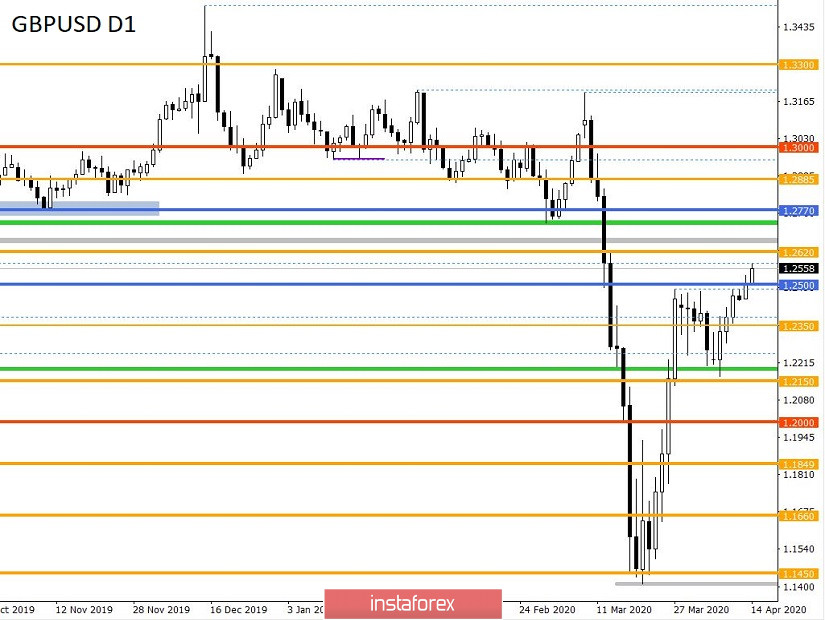
Using integrated analysis, we can see that the price broke the level of 1.2500 and consolidated above it. This means that the stagnation last week [1.2440 / 1.2485] was not in vain, because acceleration occurred, and the quote formed an impulse of more than 60 points locally. Meanwhile, the speculative interest did not meet the expectations of the market, so the surge in the morning was almost immediately won back. Nevertheless, long positions still remained. Against this background, the quote gradually returned to the level of 1.2500, and the high during the morning surge is 1.2534.
Drastic changes were recorded during the past two weeks. The quote updated the highs on March 27, and the side corridor of 1.2150/1.2500 is no longer considered the main movement.
The upward movement from 1.2150 (it was April 7) also grew into something more. However, it's still quite early to assume the resumption of the upward trend because local fluctuations can still happen due to the persisting external background and the panic mood of the market.
Meanwhile, analyzing the past trading day, it is worth noting that the activity of GBP/USD is quite similar to that of EUR/USD. The only difference is that the pound managed to maintain an upward trend towards the end of the day.
In terms of volatility, there's a twofold acceleration relative to Friday. However, comparing it to the daily average, the slowdown is 50%.
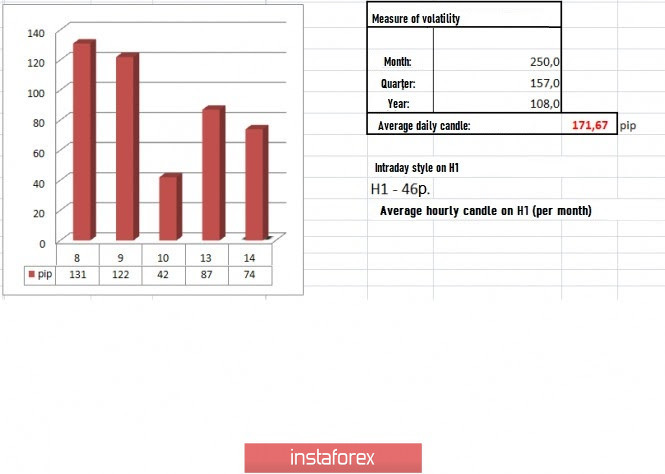
Details of volatility: Monday - 165 points; Tuesday - 245 points; Wednesday - 172 points; Thursday - 358 points; Friday - 359 points; Monday - 144 points; Tuesday - 271 points; Wednesday - 676 points; Thursday - 354 points; Friday - 522 points; Monday - 267 points; Tuesday - 296 points; Wednesday - 333 points; Thursday - 452 points; Friday - 352 points; Monday - 148 points; Tuesday - 227 points; Wednesday - 108 points; Thursday - 126 points; Friday - 198 points; Monday - 116 points; Tuesday - 217 points; Wednesday - 131 points; Thursday - 122 points; Friday - 42 points; Monday - 87 points. The average daily indicator relative to the dynamics of volatility is 171 points [see table of volatility at the end of the article].
Looking at the trading chart in general terms [the daily period], we see that the upward movement on March 20 received a new life, as the high has been updated, and there are 500 points left before the completion of the V-shaped model.
Meanwhile, the coronavirus continues to set anti-records. The total number of cases all over the world is almost 2 million, so, since the number of cases increase by less than 100 thousand everyday, the bar may be passed today or tomorrow. Europe, represented by France, has already announced the extension of quarantine measures until May 11. Britain is also considering extending the quarantine to at least May 7.
According to the Center for Economic and Business Research in UK, the quarantine costs the UK economy about £ 2.4 billion everyday.
Therefore, the extension of quarantine does not have positive effects on countries' economies.
We again don't have anything interesting in the economic calendar today. The only good news is that Europeans and Britons have returned to the market from a two-day weekend, thereby restoring trading volumes.
Further development
As we can see in the current trading chart, there are attempts to maintain the upward trend, so the quote managed to reach 1.2575. Such attempts may lead to a variable stagnation, possibly within 1.2500 / 1.2580. Meanwhile, with regards to the existing platform, it will soon become clear whether buyers will be able to maintain their positions. Moreover, the quotes may be able to move to the subsequent levels and develop a complete V-shaped model.
Relative to the emotional component, a slight decrease in the coefficient of speculative activity is recorded. However, this is probably temporary.
Analyzing the work schedule by the minute, we see an interesting picture, where an upward spiral took place in the Asian sessions. However, just before the European session started, a slowdown, expressed in consolidation of Doji candles, occurred. From trading practice, this formation can serve as a platform for further acceleration.
Therefore, we can assume that the boundaries of 1.2500 / 1.2580 are the main scope of the acceleration. However, the consolidation in the morning could shift the boundaries of amplitude, so we may also consider the boundaries of 1.2520 / 1.2575. Work is based on the method of breaking down the established boundaries and catching the pulse.
Based on the information above, we formulated these trading recommendations:
- Open buy positions above 1.2575, targeting movement up to 1.2620.
- Open sell positions below 1.2520, targeting movement up to 1.2490-1.2440.
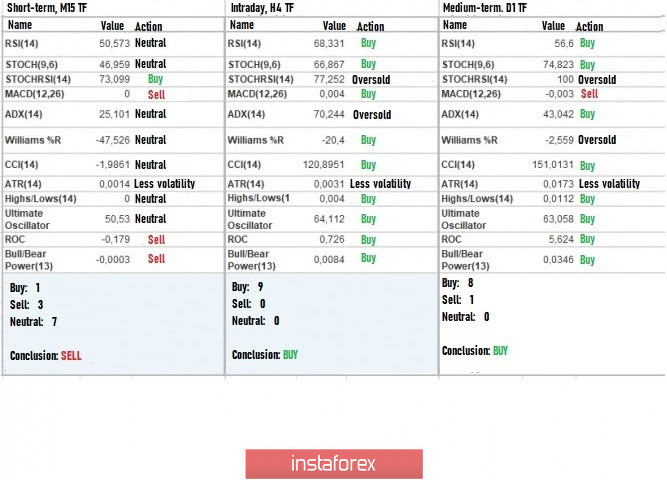
Indicator analysis
Analyzing the different sector of timeframes (TF), we see that due to the new round of upward movement, the indicators on the hourly and daily periods show a buy signal. Minute intervals, on the other hand, show fluctuations, having a variable signal.
Volatility per week / Measurement of volatility: Month; Quarter; Year
The volatility measurement reflects the average daily fluctuation calculated by Month / Quarter / Year.
(April 14 was built by taking into account the time of publication of the article)
The current volatility is 74 points. This is 56% lower than the daily average. Therefore, we can assume that if the quote succeeds in overcoming the established boundaries, acceleration may give us additional 30-40% of the current fluctuation.
Key levels
Resistance Zones: 1.2620; 1.2725 *; 1.2770 **; 1.2885 *; 1.3000; 1.3170 **; 1.3300 **; 1.3600; 1.3850; 1.4000 ***; 1.4350 **.
Support Areas: 1,2500; 1.2350 **; 1.2280 (1.2240); 1.2150 **; 1.2000 *** (1.1957); 1.1850; 1.1660; 1.1450 (1.1411); 1.1300; 1,1000; 1,0800; 1,0500; 1,0000.
* Periodic level
** Range Level
*** Psychological level
**** The article is built based on the principle of conducting a transaction, with daily adjustments