GBP/USD 5M
The GBP/USD pair also moved in one direction on July 14 - up. However, at the same time, a whole mass of signals was formed, a good half of which should be filtered out. However, more on that later. So far, it should be noted that the upward movement began in the very morning, when the inflation report was published in the UK, which, like in the US, accelerated even more and exceeded analysts' forecasts. True, in Britain, the consumer price index rose to only 2.5% y/y, and in the United States - to 5.4%. Nevertheless, such numbers have not been seen in Britain for a very long time. Thus, it seems that the British pound rose on the same market assumptions about a faster rollback of the quantitative stimulus program as the US dollar a day earlier. One way or another, but the pound/dollar pair continues to trade in the "swing" mode, that is, constantly changing the direction of movement, which is especially clearly seen on the hourly timeframe. Now let's analyze all the trading signals of the past day. In principle, signals began to form immediately in the European session. The first of them - a breakthrough of the Senkou Span B and Kijun-sen lines should have been filtered out, since it was formed exactly at the time when the British inflation report was published. However, you shouldn't be upset because of the missed signal, because after that the price bounced off Senkou Span B three more times. In parallel, having managed to rebound from the nearest target level of 1.3859. Thus, a long position should be opened at the second buy signal, close it near the level of 1.3859, immediately open a short position, close them near Senkou Span B and immediately open new longs. These three trades brought in a profit of about 26 points. The last deal is especially important, since the price surpassed the 1.3859 level during its development, but it could not reach the next target level of 1.3898 and turned down. And by the middle of the US trading session, when we advised you to manually close all trades, the price went below the level of 1.3859, so a long position should have been manually closed anyway.
Overview of the EUR/USD pair. July 15. Will Jerome Powell's opinion on QE change?
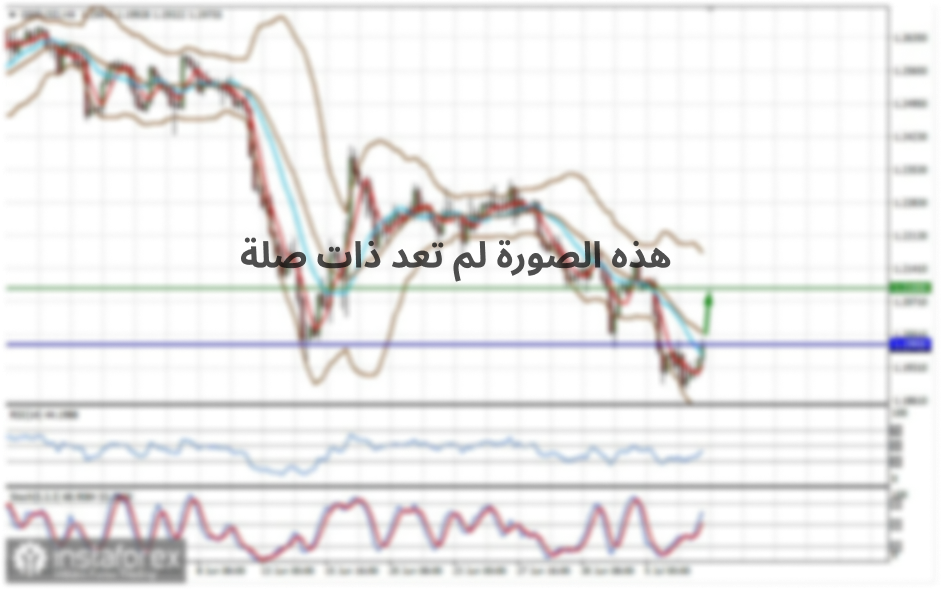
GBP/USD 1H
There is still no trend line or channel on the hourly timeframe, and the pound's movement looks like a "swing". There is no trend, so trading on the hourly timeframe is extremely difficult right now. Since the price surpassed the previous local high (1.3898) a couple of days ago, there were certain hopes that the upward movement will continue. However, we see that the bulls have not yet managed to develop this movement. Overall, the pound/dollar pair is still the most confusing pair at this time. In technical terms, we continue to draw your attention to the most important levels and recommend trading from them: 1.3731, 1.3800, 1.3859 and 1.3898. Senkou Span B (1.3816) and Kijun-sen (1.3825) lines can also be sources of signals. It is recommended to set the Stop Loss level at breakeven when the price passes 20 points in the right direction. The Ichimoku indicator lines can move during the day, which should be taken into account when looking for trading signals. The UK will publish reports on unemployment, the number of applications for unemployment benefits, changes in average earnings on Thursday. Meanwhile, we have a report on claims for unemployment benefits and a speech by Jerome Powell in the US. We believe that none of these events will be capable of causing a serious reaction from traders.
We also recommend that you familiarize yourself with the forecast and trading signals for the EUR/USD pair.
COT report
The GBP/USD pair fell by 35 points during the last reporting week (June 29-July 5). However, Friday's upward gains in the British currency were not included in the latest published Commitment of Traders (COT) report. Thus, we cannot yet know if the mood of the major players has become more bullish over the past few trading days. As a reminder, COT reports are released with a three-day delay. However, even according to the latest published COT report, we can conclude that the group of "non-commercial" traders has become more bullish. Professional traders opened almost 5,000 buy contracts (longs) and almost 2,000 sell contracts (shorts) during the reporting week. Thus, the net position of this group of traders increased by 3,000 contracts. The total number of open purchase contracts also exceeds the number of sales contracts. Therefore, the British currency, according to COT reports, has an excellent chance of resuming the upward trend. Moreover, global technical and fundamental factors also speak in favor of this. The indicators are now showing complete uncertainty. On the one hand, the green and red lines (net positions of the "non-commercial" and "commercial" groups) are approaching each other, which indicates the end of the trend. On the other hand, when the pound was actively growing, these lines did not move away from each other, which suggests the presence of external important factors that affect the supply and demand of the dollar and the pound. The second indicator shows that the net position of professional traders has been declining since March, but their mood is still bullish.
Explanations for the chart:
Support and Resistance Levels are the levels that serve as targets when buying or selling the pair. You can place Take Profit near these levels.
Kijun-sen and Senkou Span B lines are lines of the Ichimoku indicator transferred to the hourly timeframe from the 4-hour one.
Support and resistance areas are areas from which the price has repeatedly rebounded off.
Yellow lines are trend lines, trend channels and any other technical patterns.
Indicator 1 on the COT charts is the size of the net position of each category of traders.
Indicator 2 on the COT charts is the size of the net position for the non-commercial group.


