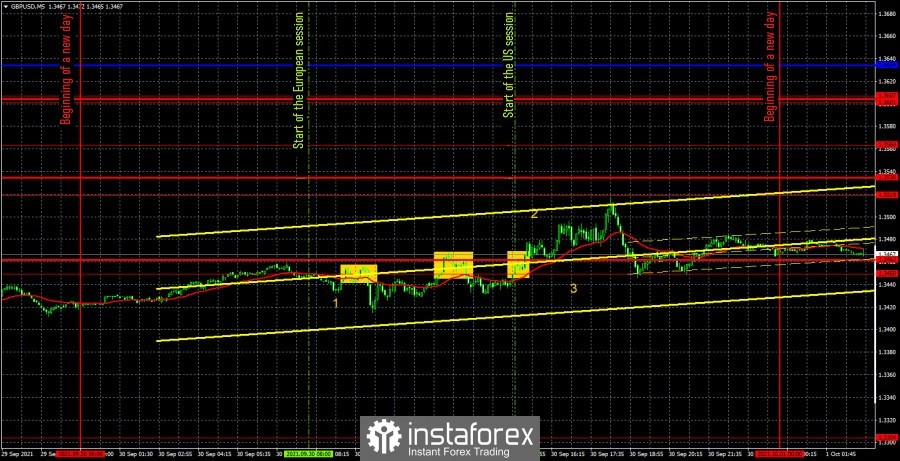
GBP/USD 5M

The GBP/USD pair was also traded in a more familiar style on September 30. The trend movement seems to have been, but not so good as in the last couple of days. The main thing is that after a two-day collapse of the British currency, the time has finally come for a correction, which we expected the day before yesterday. However, the markets were too impressed by the fact that in a developed country like the UK, there was a shortage of fuel and they could not find truck drivers. Therefore, the pound fell quite calmly by 300 points and only then began an upward correction. A report on changes in GDP for the second quarter was published early in the morning in the UK, which turned out to be significantly better than forecasted. The time when this report was published is marked with "1". Attention, the market reaction to one of the most important reports on the state of the economy was a movement of 20 points. All US reports and events were also ignored, which is clearly seen in the chart above. Thus, the fundamental background did not have any influence on the pair's movement yesterday. Trading signals throughout the day were also not the best. The first sell signal turned out to be false - the price bounced off the level of 1.3450. The second sell signal is also false, when the price bounced off the levels 1.3450 - 1.3462. Since these levels were very close to each other, it was necessary to consider them in pairs. In the first case, we managed to avoid a loss on a short position, since the pair went down 20 points, which was enough to set Stop Loss to breakeven. A loss of 25 points was recorded on the second deal, which is one of the highest losses for one deal in recent months. The third buy signal should not have been worked out any more, since two false signals had already been formed near the levels 1.3450 and 1.3462. Ironically, it was this signal that turned out to be profitable in the end.
GBP/USD 1H
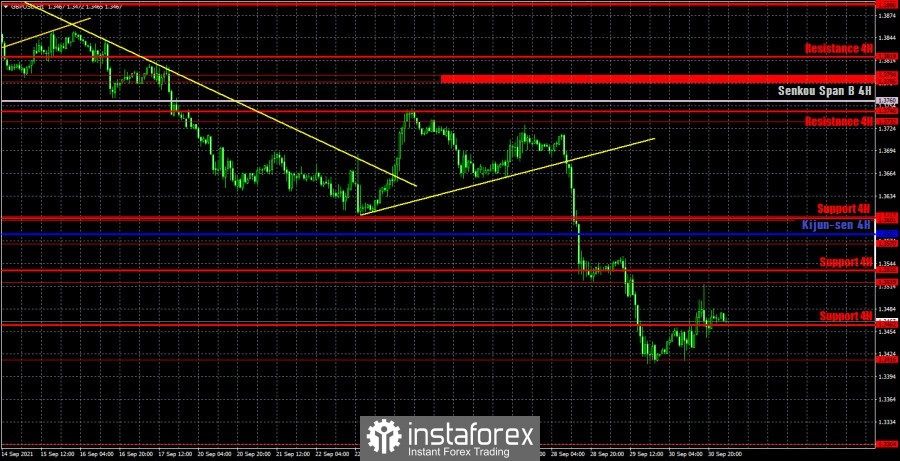
The GBP/USD pair began an upward correction on the hourly timeframe. However, at this time there is neither a trendline nor a channel to understand the approximate purpose of this correction and the ability of the downward trend to persist. Recall that much of this trend is a two-day collapse in the pound. Thus, purely hypothetically, the pair can now return to the level of 1.3732. We distinguish the following important levels on October 1: 1.3304, 1.3416, 1.3519, 1.3570, 1.3601 - 1.3607. Senkou Span B (1.3760) and Kijun-sen (1.3583) lines can also be sources of signals. It is recommended to set the Stop Loss level at breakeven when the price passes 20 points in the right direction. The Ichimoku indicator lines can move during the day, which should be taken into account when looking for trading signals. The UK Manufacturing PMI is due on Friday, but the way markets reacted to yesterday's GDP report suggests there will be no reaction to the report. Moreover, this is the final assessment for September, which rarely differs from the first assessment. There will be no more interesting events in Britain today. In America, the most important event today will be the ISM manufacturing index, but all other reports are of low significance. There may still be some kind of reaction to the consumer sentiment index from the University of Michigan, if it does not strongly correspond to the predicted value.
We also recommend that you familiarize yourself with the forecast and trading signals for the EUR/USD pair.
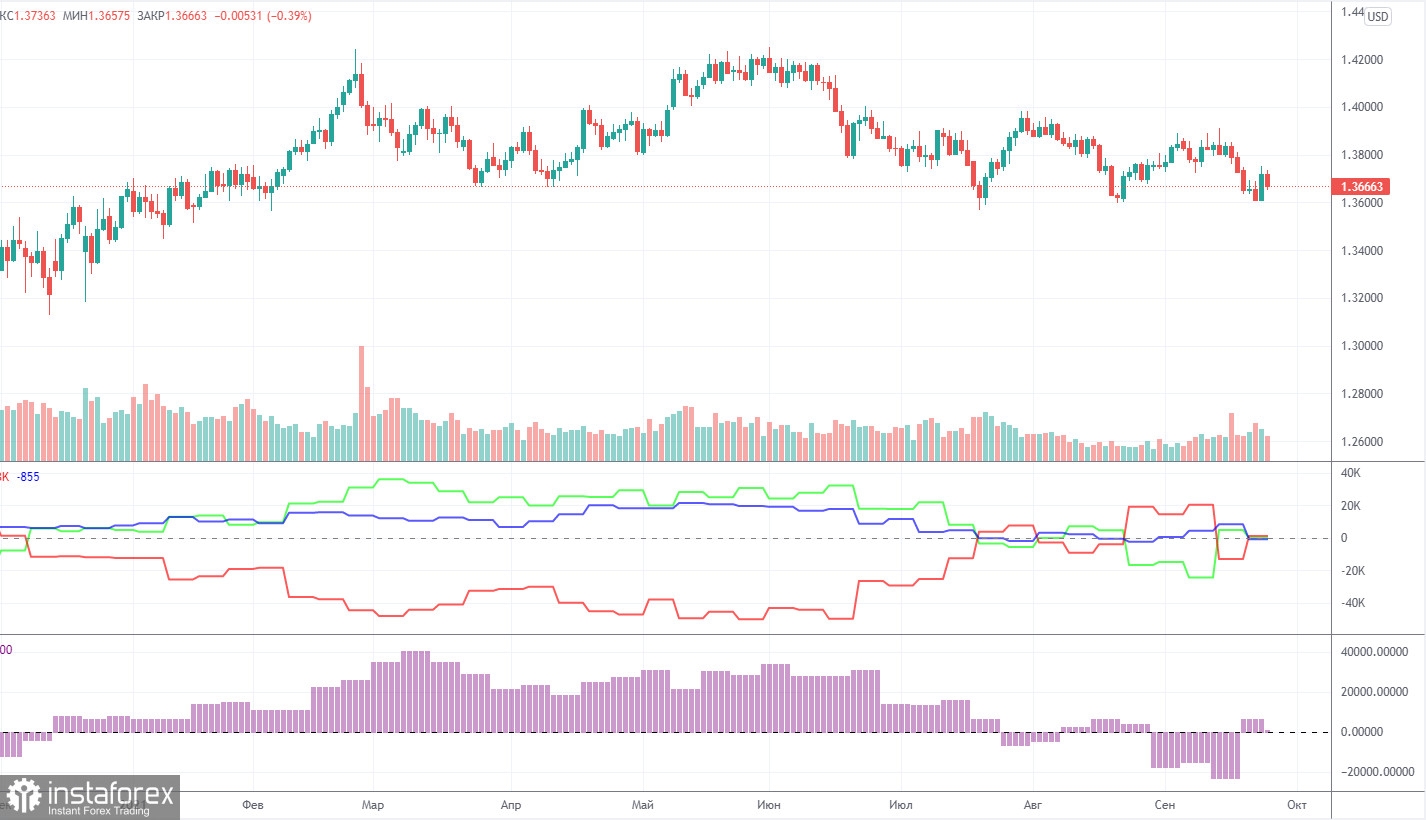
COT report
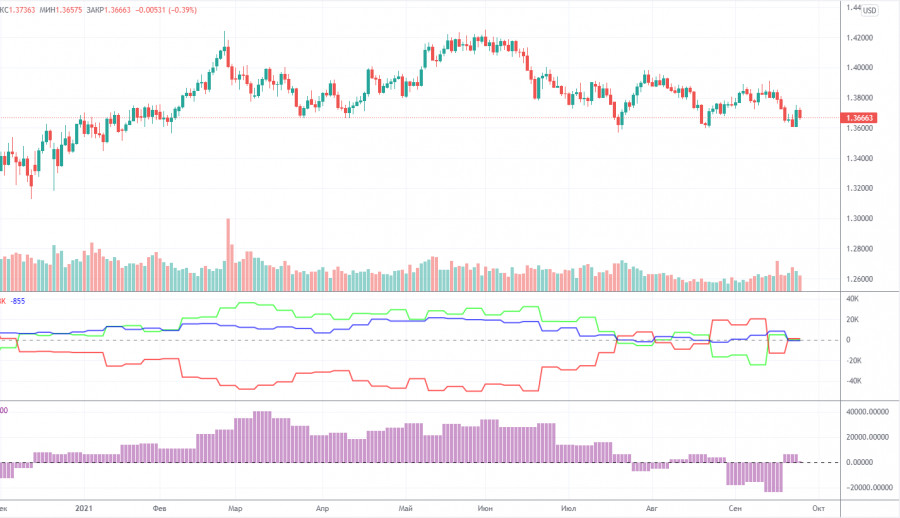
Major players weakened their bullish sentiment during the last reporting week (September 14-20). Although it is now as neutral as possible. The fact is that the value of the net position for the group of "non-commercial" traders is now equal to 0 (approximately). Consequently, neither bulls nor bears have the initiative. Moreover, in the last couple of months, the mood of professional traders has been constantly changing, as the net position is either increasing or decreasing. Thus, from our point of view, the conclusion is obvious: the Commitment of Traders (COT) report does not indicate either bullish or bearish sentiment. The problem lies in the plane of the same level of 1.3600, which can be seen in the second chart even better than in the first one. The pair cannot go below this level, but it is not yet able to start an upward trend. Therefore, we need to wait for a new development of the level of 1.3600. Although this week it has already done so and another rebound followed. Therefore, an upward movement to the previous local high may begin next week. We also draw attention to the fact that the pound was unable to continue its downward movement even at a time when non-commercial traders were actively increasing their short positions. This "dip" in the net position below zero is clearly visible on the charts of both indicators in the chart. That is, the pound did not fall below 1.3600 even when it was actively sold by large players.
Explanations for the chart:
Support and Resistance Levels are the levels that serve as targets when buying or selling the pair. You can place Take Profit near these levels.
Kijun-sen and Senkou Span B lines are lines of the Ichimoku indicator transferred to the hourly timeframe from the 4-hour one.
Support and resistance areas are areas from which the price has repeatedly rebounded off.
Yellow lines are trend lines, trend channels and any other technical patterns.
Indicator 1 on the COT charts is the size of the net position of each category of traders.
Indicator 2 on the COT charts is the size of the net position for the non-commercial group.