EUR/USD 5M
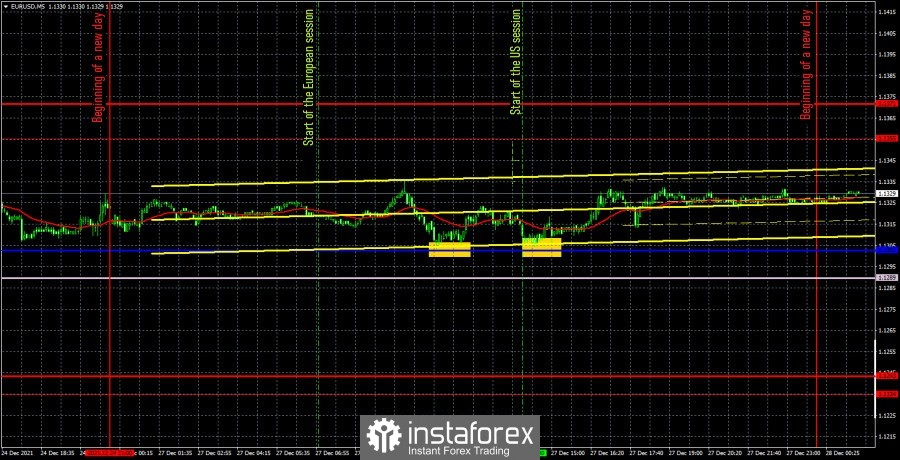
The EUR/USD pair continued to trade exclusively sideways during the first trading day of the week. In principle, it is visible on the hourly timeframe and the 5-minute timeframe. Since the blatant flat with low volatility is still present, not only is it difficult to trade the pair now, but it also not advisable. Flat is always bad for traders, and the euro/dollar has been in it for a month. Nevertheless, by some miracle, two trading signals were generated on Monday. In the first case, the pair bounced off the critical line, forming a buy signal. In the second - a similar rebound from the Kijun-sen line. Only one deal was opened, and during the formation of the second signal, traders should have been in the long positions and just continue to stay in them. As a result, the price went up 15-20 points, and traders had to manually close long positions in a profit of about 15 points. It should also be noted that buy signals could be ignored, since the Ichimoku indicator lines are weak in the flat. Still, the signals themselves were not bad yesterday, so it was possible to work out. There were no macroeconomic statistics on Monday in either the United States or the EU.
EUR/USD 1H
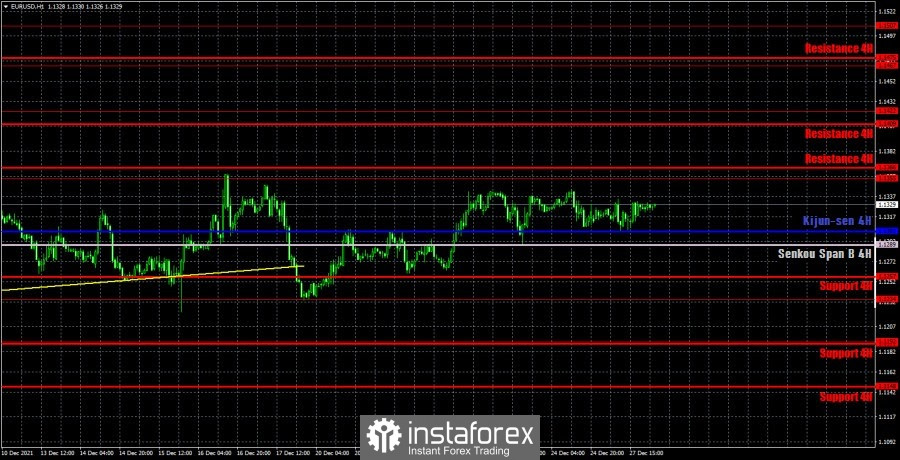
On the hourly timeframe, you can clearly see that the pair continues to trade exclusively between the levels of 1.1234 and 1.1355. And at this time it has no reason to leave the specified range. And traders have no reason to actively trade. Thus, the pair may even continue to move between the Kijun-sen line and the 1.1355 level. We highlight the following levels for trading on Tuesday - 1.1192, 1.1234, 1.1355, 1.1422, as well as the Senkou Span B (1.1289) and Kijun-sen (1.1302) lines. The Ichimoku indicator lines can change their position during the day, which should be taken into account when looking for trading signals. Signals can be "rebounds" and "breakthroughs" of these levels and lines. Do not forget about placing a Stop Loss order at breakeven if the price moves 15 points in the right direction. This will protect you against possible losses if the signal turns out to be false. You should also take into account the fact that the pair remains flat, so the lines of the Ichimoku indicator are weak. The European Union and the United States do not have any important events or macroeconomic reports on Tuesday, so we do not expect strong movements today.
We advise you to familiarize yourself:
Overview of the EUR/USD pair. December 28. US inflation bears a resemblance to the Titanic.
Overview of the GBP/USD pair. December 28. The British currency continues to grow on the "technique".
Forecast and trading signals for GBP/USD for December 28. Detailed analysis of the movement of the pair and trade deals.
Analysis of the COT report
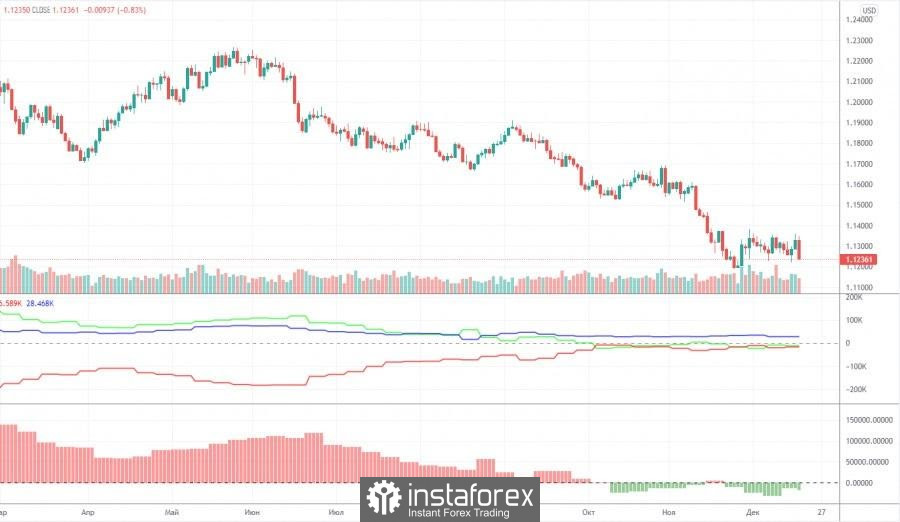
The mood of non-commercial traders has become... a little more bearish during the last reporting week (December 7-13). The "non-commercial" group of traders now has more short positions than long ones, but this advantage is minimal. The difference is only 18,000 contracts, which is not so much. During the reporting week, professional traders closed 7,200 buy contracts (longs) and 2,800 sell contracts (shorts). Thus, the net position of professional players decreased by 4,000. However, the main thing to note is that the green and red lines of the first indicator (indicating the change in the net positions of the non-commercial and commercial groups) have been near the zero level for a long time, as well as in close proximity to each other. That is, in the last few months, when the European currency continued to fall against the dollar, the major players no longer increased their shorts. Thus, the question arises, why did the euro fall at all if market participants did not sell it? Perhaps global factors, such as changes in the balance between the EU and US money supply, are interfering in the exchange rate formation process again. But according to the Commitment of Traders (COT) reports, we can only conclude that the bearish mood is minimal and has not intensified in recent months. Nevertheless, taking into account the fundamental background, the euro may continue to fall. And the technical picture does not yet give any reason to assume the completion of the fall of the euro currency. The mood of the major players remains bearish, but at the same time the bulls do not seek to change anything.
Explanations for the chart:
Support and Resistance Levels are the levels that serve as targets when buying or selling the pair. You can place Take Profit near these levels.
Kijun-sen and Senkou Span B lines are lines of the Ichimoku indicator transferred to the hourly timeframe from the 4-hour one.
Support and resistance areas are areas from which the price has repeatedly rebounded off.
Yellow lines are trend lines, trend channels and any other technical patterns.
Indicator 1 on the COT charts is the size of the net position of each category of traders.
Indicator 2 on the COT charts is the size of the net position for the non-commercial group.


