empty
 
 
04.07.2022 04:07 PM
EUR/USD and GBP/USD technical analysis on July 4, 2022

EUR/USD

This image is no longer relevant

Higher time frames

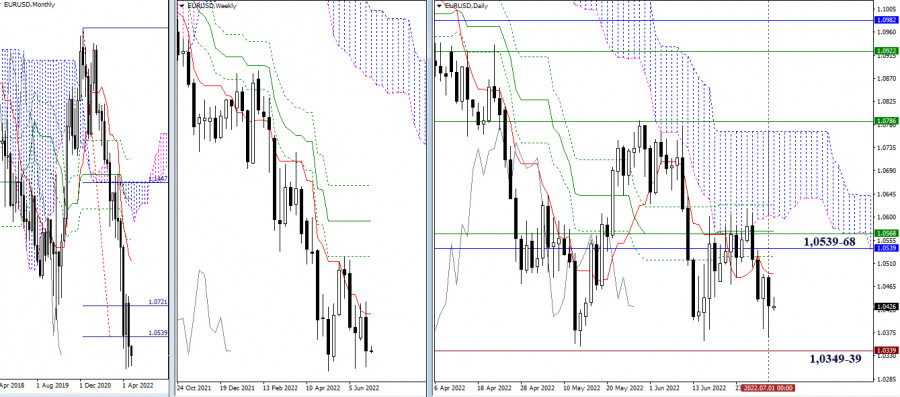
The euro bulls failed to show any impressive results last week and the same is true about bears. So, the pair stayed within the boundaries of the previous weekly consolidation zone. The downward target and support are found at the low extremum points of 1.0349 – 39. The upper boundary is formed by the daily Cross pattern, the weekly short-term trend at 1.0568, and monthly support at 1.0539. If the price manages to settle firmly beyond these boundaries, we need to reevaluate the chart to see further prospects.

This image is no longer relevant

H4 – H1

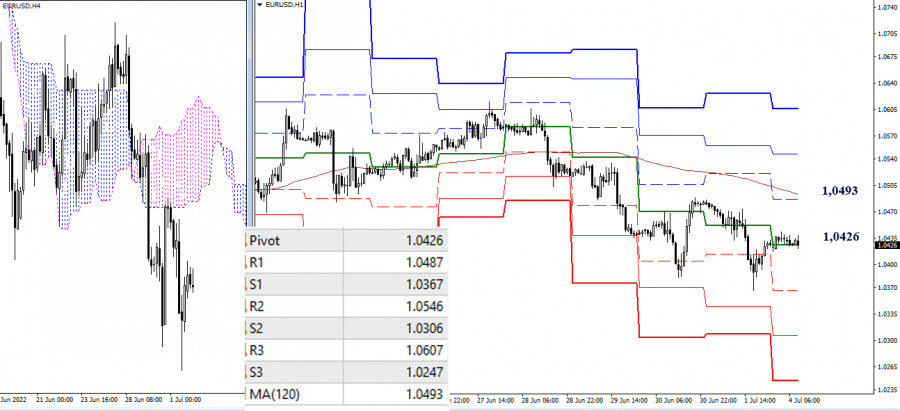
After hitting a new low on Friday, the pair is now going through an upside correction. Bears are in control of the market on lower time frames. The key levels of 1.0426 (central pivot point of the day) and 1.0493 (weekly long-term trend) serve as upward targets. Consolidation above these levels and a reversal of the moving average can change the current market balance. In this case, other intraday targets will be the resistance zones found at the standard pivot levels of 1.0546 (R2) and 1.0607 (R3). If the pair finishes the correction and resumes its decline, the downward targets on the intraday chart will be the resistance found at the standard pivot levels of 1.0367 – 1.0306 – 1.0247.

***

GBP/USD

This image is no longer relevant

Higher time frames

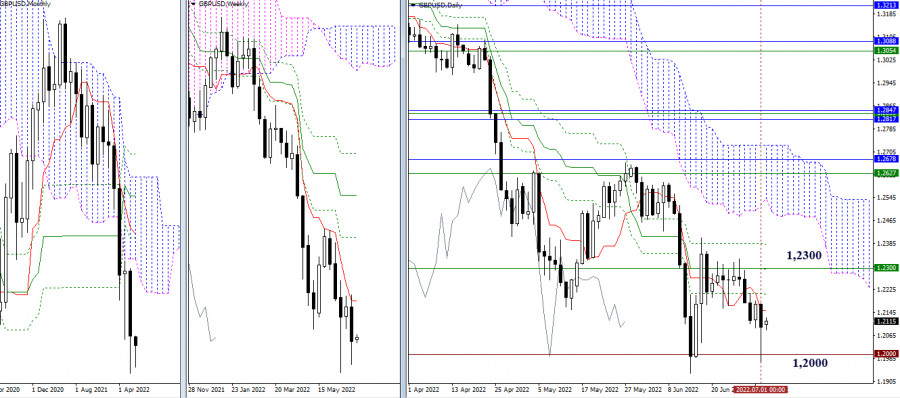
Last week, bulls failed to push the pair through the resistance level of 1.2300 (weekly short-term trend). At the same time, bears managed to retest the mark of 1.2000. Those of them who have enough strength to bring the price out of the mentioned boundaries will gain a strong foothold and develop a further movement.

This image is no longer relevant

H4 – H1

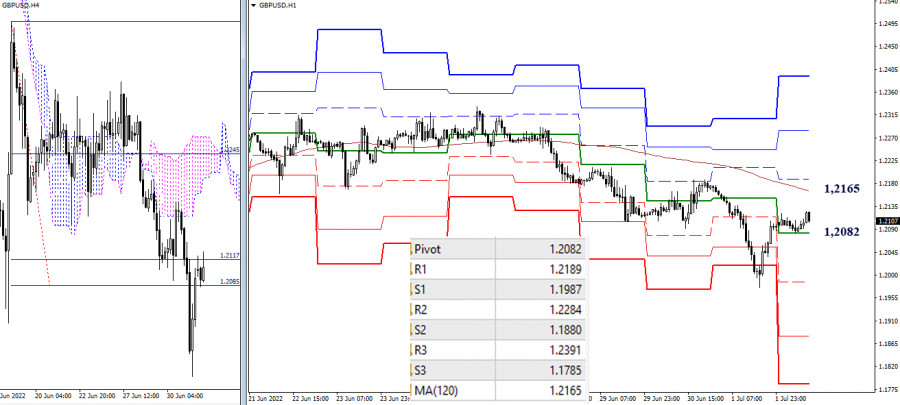
A decline that took place on Friday ended with an upside correction. Buyers managed to bring the price up and now use the central daily pivot point of 1.2082 as the main support. The next target is seen at the weekly long-term trend of 1.2165. Consolidation above this level and a reversal of the moving average will change the market balance on lower time frames in favor of the bulls. In this case, their intraday targets will be the resistance areas located at the standard pivot levels of 1.2189 – 1.2284 – 1.2391. Bear will need to return to the level of 1.1975 to resume the downtrend. Other downward targets on the intraday chart are located at the level of 1.1987 – 1.1880 – 1.1785 (resistance at the standard pivot points).

***

This technical analysis is based on:

For higher time frames: Ichimoku Kinko Hyo (9.26.52) + Fibo Kijun levels

For H1: Pivot Points (standard) + 120-day Moving Average (weekly long-term trend)

Evangelos Poulakis,
الخبير التحليلي لدى شركة إنستافوركس
© 2007-2024
كسب عائد من تغيرات أسعار العملات المشفرة مع إنستافوركس.
قم بتحميل منصة التداول ميتاتريدر 4 وافتح أول صفقة.
  • Grand Choice
    Contest by
    InstaForex
    InstaForex always strives to help you
    fulfill your biggest dreams.
    انضم إلى المسابقة
  • إيداع الحظ
    قم بإيداع 3,000 دولار في حسابك واحصل على $8,000 وأكثر من ذالك!
    في مايو نحن نقدم باليانصيب $8,000 ضمن حملة إيداع الحظ!
    احصل على فرصة للفوز من خلال إيداع 3,000 دولار في حساب تداول. بعد أن استوفيت هذا الشرط، تصبح مشاركًا في الحملة.
    انضم إلى المسابقة
  • تداول بحكمة، اربح جهازا
    قم بتعبئة حسابك بمبلغ لا يقل عن 500 دولار ، واشترك في المسابقة ، واحصل على فرصة للفوز بأجهزة الجوال.
    انضم إلى المسابقة
  • بونص 100٪
    فرصتك الفريدة للحصول على بونص 100٪ على إيداعك
    احصل على بونص
  • بونص 55٪
    تقدم بطلب للحصول على بونص 55٪ على كل إيداع
    احصل على بونص
  • بونص 30٪
    احصل على بونص 30٪ في كل مرة تقوم فيها بتعبئة حسابك
    احصل على بونص

المقالات الموصى بها

لا تستطيع التحدث الآن؟
اطرح سؤالك في الدردشة.
Widget callback