EUR/USD 5M
The EUR/USD pair was trading much weaker and worse than in the previous days on the fourth trading day of the week. Volatility was low, just over 50 points. There was movement in a certain direction, but it was too weak. There were practically no macroeconomic reports. No fundamental events at all. There were signals, but due to weak volatility, none of them were worked out properly. In general, this is not the best day for trading. In fact, all the signals of the day on the 5-minute timeframe were formed near the extreme level of 1.2190. Almost immediately at the beginning of the trading session, the pair's quotes overcame this level, which meant a buy signal. However, the upward movement did not last long, the price almost immediately turned down, settled below the level of 1.2190, and then up again – and again above the level of 1.2190. So two false signals were formed in just half an hour, which brought traders a loss of 20 points. Unpleasant. Then the price returned to the level of 1.2190 several times and overcame it, but these signals should have already been filtered out, since the level did not show itself strong in the auction on May 20. European Central Bank President Christine Lagarde's speech was scheduled in the European Union, which began exactly with the opening of the US trading session. However, as we can see, traders did not react to this event. However, in recent years, Lagarde rarely spoils the markets with really important information. Therefore, it is not surprising. Just half an hour later, a report on applications for unemployment benefits, primary and secondary, was published in America, which almost completely coincided with analysts' forecast. And the report itself was far from the most important. Therefore, there was no reaction to it either.
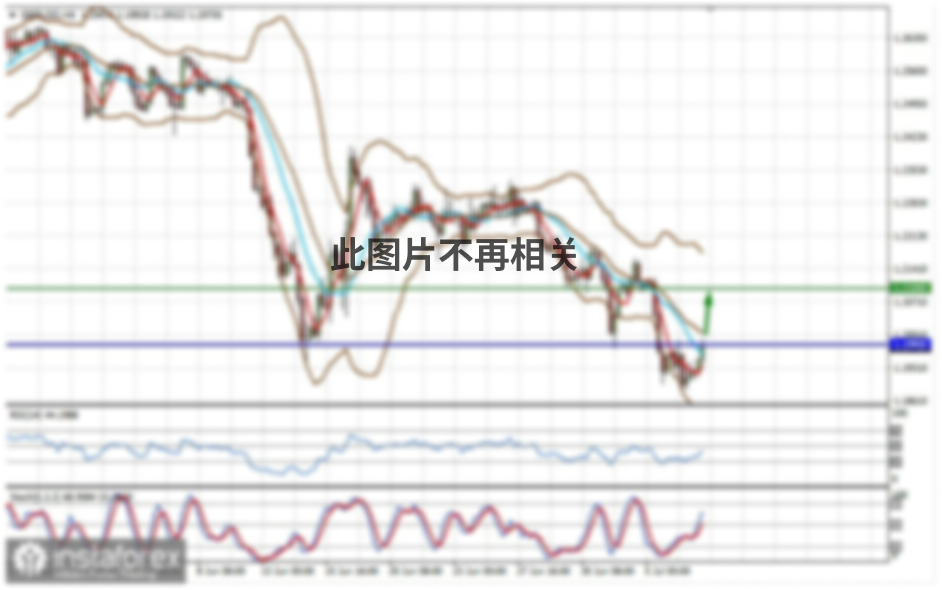
EUR/USD 1H
The upward trend persists on the hourly timeframe. The pair corrected to the level of 1.2160, and at the same time to the critical line and rebounded from them. Therefore, the upward movement has resumed at the moment. Thus, in the near future, we expect the euro to return to the level of 1.2243. In our fundamental articles, we have already said that the fundamental background for the euro/dollar pair does not change, so there is no reason to expect the end of the upward trend. At least, it does not make sense to talk about this until the price has settled below the trend line. We still recommend trading from the important levels and lines that are marked on the hourly timeframe. The nearest important levels at this time are 1.2160, 1.2190 and 1.2243, as well as the Senkou Span B (1.2082) and Kijun-sen (1.2173) lines. The lines of the Ichimoku indicator can move throughout the day, which should be taken into account when searching for trading signals. Signals can be rebounds or breakthroughs of these levels and lines. Do not forget about placing a Stop Loss order at breakeven if the price moves 15-20 points in the right direction. This will protect you against possible losses if the signal turns out to be false. Today, the European Union is scheduled to publish business activity indices in the services and manufacturing sectors, as well as another speech by ECB President Christine Lagarde. All these data are unlikely to cause a market reaction, but you should still pay attention to them. In the United States, business activity indices in the services and manufacturing sectors will also be published, but these data are also unlikely to cause a strong reaction from traders.
We also recommend that you familiarize yourself with the forecast and trading signals for the GBP/USD pair.
COT report
The EUR/USD pair increased by 60 points during the last reporting week (May 4-10). Thus, the European currency continues to be in high positions and may renew its 2.5-year highs in the coming weeks. Professional traders, who have started to reduce Buy-contracts (longs) since last September, have started to increase them again in the last few weeks. Recall that the Commitment of Traders (COT) reports, firstly, do not take into account the amount of money poured into the economy (any), and secondly, they do not reflect the demand for the dollar. Thus, in recent months, COT reports do not always reflect the real picture of what is happening in the foreign exchange market. Recall that large players can sell off the euro, but if the Federal Reserve pours trillions of US dollars, the euro will still rise in price, and the COT reports will show that the demand for the euro is falling. However, recently, the group of non-commercial traders seems to have rethought some things and will now follow the trend itself, the tone of which is set by the Fed. Commercial traders opened 17,000 new buy contracts and 5,500 sell contracts during the reporting week. Thus, the net position grew by 11,500 at once, which is quite a lot. The first indicator in the chart above shows the divergence of the lines showing the net positions of commercial and non-commercial traders, so at this time we can conclude that the upward trend has resumed. The second indicator also shows that the "non-commercial" group has begun to increase buy contracts on the European currency.
Explanations for the chart:
Support and Resistance Levels are the levels that serve as targets when buying or selling the pair. You can place Take Profit near these levels.
Kijun-sen and Senkou Span B lines are lines of the Ichimoku indicator transferred to the hourly timeframe from the 4-hour one.
Support and resistance areas are areas from which the price has repeatedly rebounded off.
Yellow lines are trend lines, trend channels and any other technical patterns.
Indicator 1 on the COT charts is the size of the net position of each category of traders.
Indicator 2 on the COT charts is the size of the net position for the non-commercial group.


