4-hour timeframe
Technical details:
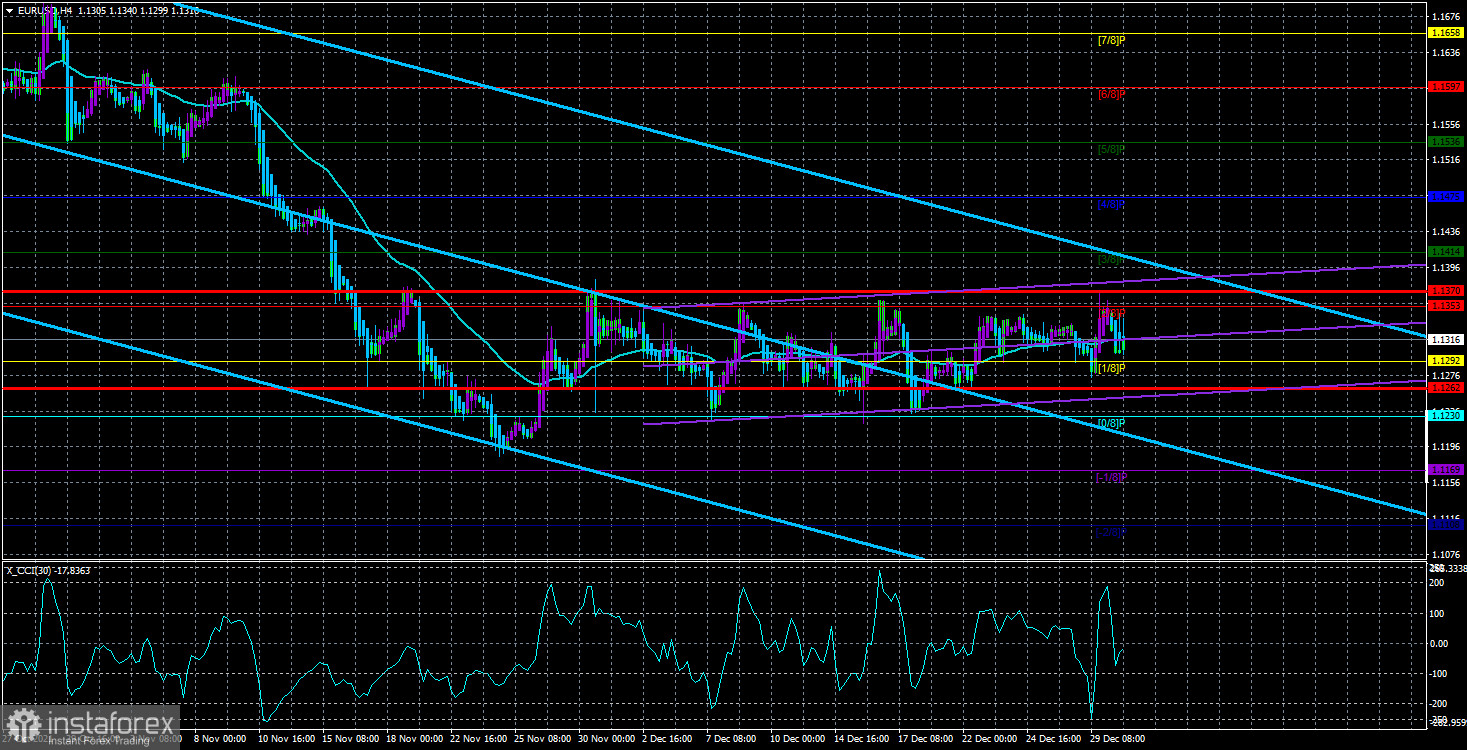
Higher linear regression channel: direction - downward.
Lower linear regression channel: direction - upward.
Moving average (20; smoothed) - sideways.
On Thursday, the EUR/USD currency pair continued trading inside the side channel between the Murray levels "0/8" - 1.1230 and "2/8" - 1.1353. Although the pair demonstrated quite good volatility and even trend movement a day earlier, it still failed to leave the side channel. It has been in it for 5 weeks, that is, the price entered it back in November. Even two meetings of central banks, the results of which were announced in mid-December, did not help the pair to exit the side channel. Thus, it can be concluded that traders began to prepare for the New Year back in November. But seriously, there were no interesting events on Thursday either in the European Union or in the States. Just like a day earlier, and two days earlier. As we have said more than once, at this time, the number one topic remains the topic of the "coronavirus" and the "omicron" strain, which continues to spread around the world. However, if the pair has been inside the side channel for more than a month, then it is hardly possible to conclude that the markets at least somehow react to the daily increase in the number of cases in any country in the world. Recall that with the "omicron strain" people are much less likely to go to hospitals than with the same "delta". Thus, the danger lies only in the fact that the more people get sick, the more the economy may shrink due to the lack of workers at various enterprises and companies. Therefore, it will be more logical to react not to omicron itself, but to the economic consequences that it can cause. And then everything will depend on whose economy will suffer the most. In our case, the EU and US economies will be compared. Given that the EU countries have already begun to introduce quarantine or at least simply tighten quarantine restrictions, we can expect a greater slowdown in the European Union. Recall that the EU economy has already been recovering in recent months and even a year much slower than the American one. Therefore, one could even assume that the European currency will continue to fall in the new year. However, we remind you that much will depend on the monetary policy of the Fed and the ECB. So far, on this issue, the advantage is also on the side of the dollar, but it should also be taken into account that one currency cannot constantly grow on the same factors. We believe that the option is not excluded, in which the markets have long worked out the factor of tightening monetary policy in the United States, so the dollar may stop getting more expensive in 2022. However, so far there are no technical signals for the beginning of a new upward trend. And any hypothesis without technical confirmation does not weigh the foreign exchange market.
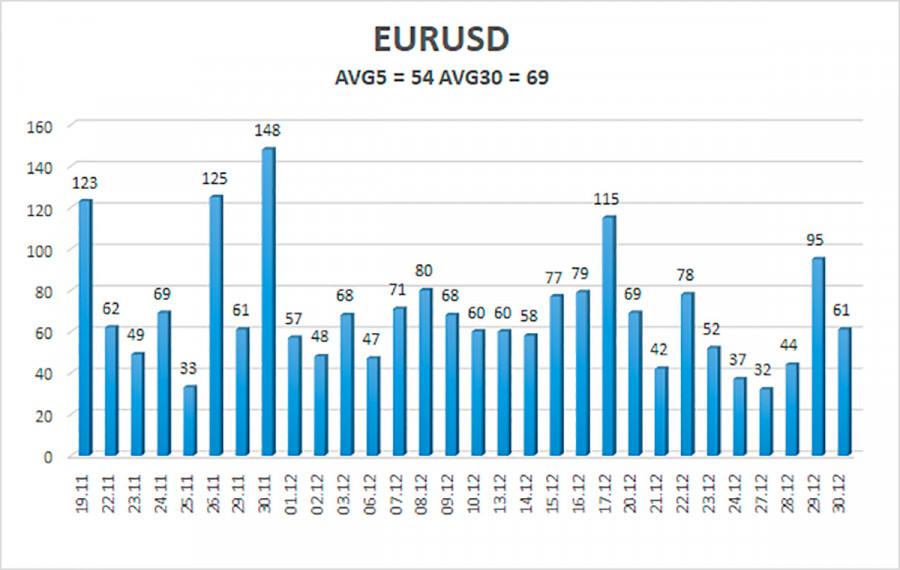
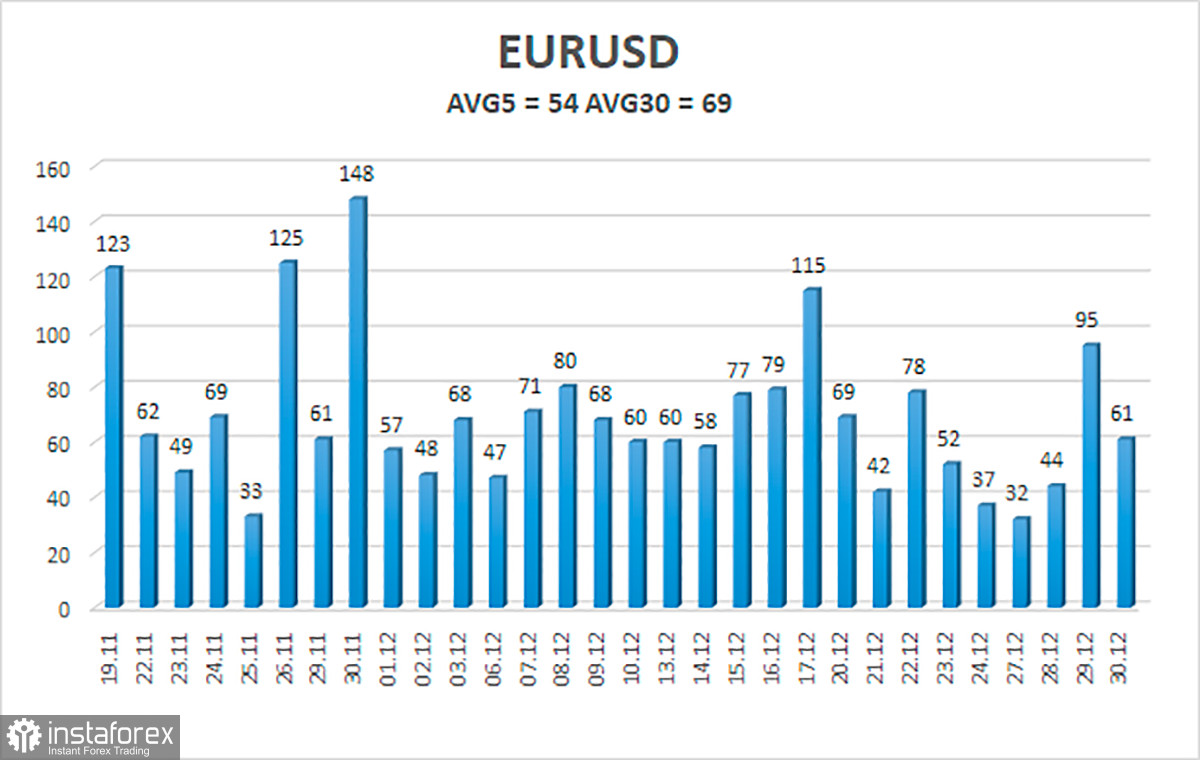
The volatility of the euro/dollar currency pair as of December 31 is 54 points and is characterized as "average". Thus, we expect the pair to move today between the levels of 1.1262 and 1.1370. A reversal of the Heiken Ashi indicator upwards will signal a new round of upward movement in the side channel 1.1230 - 1.1353.
Nearest support levels:
S1 – 1.1292
S2 – 1.1230
S3 – 1.1169
Nearest resistance levels:
R1 – 1.1353
R2 – 1.1414
R3 – 1.1475
Trading recommendations:
The EUR/USD pair continues to be located inside the 1.1230-1.1353 side channel. Thus, you can continue to trade for a rebound from the upper or lower border of this channel with the goal of the opposite border. However, it should be remembered that we are talking about a flat now, and volatility may be low during the holidays.
Explanations to the illustrations:
Linear regression channels - help determine the current trend. If both are directed in the same direction, then the trend is strong now.
Moving average line (settings 20.0, smoothed) - determines the short-term trend and the direction in which trading should be conducted now.
Murray levels - target levels for movements and corrections.
Volatility levels (red lines) - the likely price channel in which the pair will spend the next day, based on current volatility indicators.
CCI indicator - its entry into the oversold area (below -250) or into the overbought area (above +250) means that a trend reversal in the opposite direction is approaching.