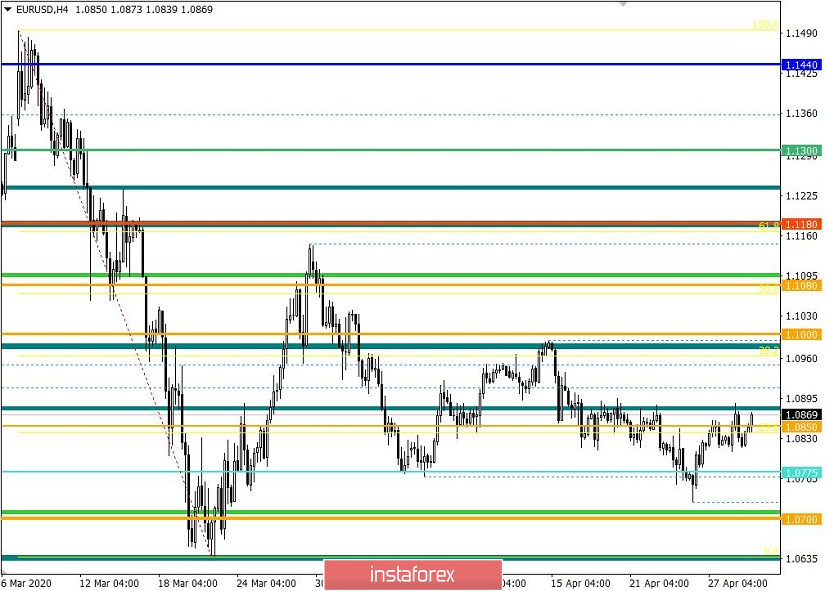
From the point of view of complex analysis, we see a repetition of the amplitude oscillation, where the mirror level plays the steering wheel 50% of the deviation, and now let's move to the details. The structure of the technical correction from the value of 1.0727 led the quote to the area of interaction of trade forces 1.0815/1.0885, which repeats the fluctuation on April 16-21. It is worth noting that the mirror level of 1.0850 refers to historical values, but in this case, it is considered a 50% deviation from the range of 1.0815/1.0885, which market participants systematically pay attention to.
Considering the past minute of the trading day, you can see an inverted V-shaped formation, where the round of long positions had a time period of 7:00-11:45 UTC+00, nd the round of short positions came for the period of 12:00-20:45 UTC+00 on the trading terminal.
Regarding the theory of downward development, we are still waiting for the resumption of the main course, which is indicated by a number of technical and fundamental factors, which was discussed in the previous review. It is worth noting that the existing platform in the form of a range of 1.0815/1.0885 can give acceleration, as it was a period earlier.
Let me remind you that the basis of our theory was the process of sequential compression of measures, where it was proved that the direction of the measures has a downward mood, and the breakdown of the variable base of 1.0768 confirmed the desire of sellers to take actions.
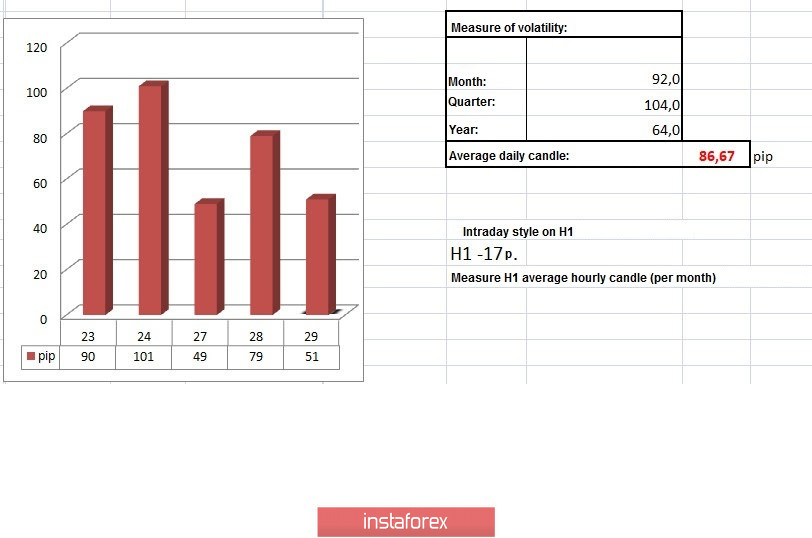
In terms of volatility, we have a local acceleration relative to the past day, which was expected if we analyze the dynamics of fluctuations, proposed in the form of statistics below.
Details of volatility: Monday - 155 points; Tuesday - 183 points; Wednesday - 115 points; Thursday - 278 points; Friday - 166 points; Monday - 151 points; Tuesday - 234 points; Wednesday - 243 points; Thursday - 326 points; Friday - 194 points; Monday - 191 points; Tuesday - 160 points; Wednesday - 133 points; Thursday - 188 points; Friday - 194 points; Monday - 134 points; Tuesday - 127 points; Wednesday - 136 points; Thursday - 147 points; Friday - 91 points; Monday - 67 points; Tuesday - 142 points; Wednesday - 72 points; Thursday - 110 points; Friday - 33 points; Monday - 74 points; Tuesday - 84 points; Wednesday - 134 points; Thursday - 95 points; Friday - 80 pips; Monday - 55 points; Tuesday - 64 points; Wednesday - 82 points; Thursday - 90 points; Friday - 101 points; Monday - 49 points; Tuesday - 79 points.
The average daily indicator is worth paying attention to, which is gradually moving away from the emotional activity of the month of March.
As discussed in the previous review, we considered the repetition of the plot of the past as a rebound from the border of 1.0885 towards 1.0815, which coincided almost 100%. The main tactic was considered to be breaking the range.
Considering the trading chart in general terms, the daily period, it is worth noting that the main downward trend has not been changed and still focuses on itself market participants.
The news background of the past day contained data on wholesale inventories in the United States, where, for everyone's surprise, a decrease of 1% was recorded, although they expected growth by the same 1%.
The market reacted positively to data on wholesale stocks, and we saw a strengthening of the US dollar almost immediately after publication.
In terms of the general informational background, we see that the epidemiological situation and the spread of COVID-19 in Europe are much better than the period before, and the peak of infection will almost pass in the United States. Against this background, statements about the revision of quarantine measures are gradually appearing, which indicates the best side for the market, but it is still too early to talk about economic recovery.
Today, in terms of the economic calendar, we have the first estimate of the United States GDP for the first quarter, where the economy is expected to decline by 4.6% (consensus 4.0%). It is worth considering that the consequences of quarantine measures on the economy will also be reflected in the second quarter, thereby the scale of losses is only calculated.
At the same time, we have the results of a two-day meeting of the Federal Committee for Open Market Operations today, where we should not wait for a change in the refinancing rate, but without exception, everyone is interested in the comments of the regulator, as well as the assessment of the US economy.
"The Fed acknowledges the worsening economic conditions and is likely to signal that rates will remain low for a long period. A sober assessment of economic activity by the Fed and other global central banks this week may well begin to shift the prevailing emphasis from political incentives to the reality of a global economic downward turn." the Bank of America report said.
Further development
Analyzing the current trading chart, we see that the quote continues to fluctuate within the range of 1.0815 / 1.0885, where the mirror level of 1.0850 still concentrates on the special attention of market participants. This kind of movement will still take place in the market, but the longer we will be in conditional accumulation, the sharper the exit from it will be.
Considering the minute-by-minute time period, you can see that at the moment of price convergence with the 1.0815 border, a round of long positions appeared, which returned the quote to the mirror level, consolidating above it.
In terms of the emotional mood of the market, you can see that the panic mood is gradually declining, but speculative activity is still at its best.
It can be assumed that the quote will continue to focus on the variables within the range of 1.0815 // 1.0850 // 1.0885, where the tactics of work will be measured both within the established boundaries and on the breakdown. At the same time, according to the development theory, we continue to consider the main move in terms of a downward move, thus the breakdown of the lower border is considered the most priority step, which will lead to a price drop to 1.0775-1.0727-1.0636.
Based on the above information, we derive trading recommendations:
- Buy positions have already been considered higher than 1.0870, towards 1.0885. We will carry out further operations after the price consolidates higher than 1.0910.
- Sell positions are considered lower than 1.0840, towards 1.0815. We will carry out further operations after the price consolidates lower than 1.0810, with the prospect of 1.0775 - 1.0735.
Indicator analysis
Analyzing a different sector of time frames (TF), we see that the indicators of technical instruments continue to signal a variable buy signal relative to hour and minute intervals. Meanwhile, daily periods keep a sell signal, referring to earlier periods.
Volatility per week / Measurement of volatility: Month; Quarter; Year
Volatility measurement reflects the average daily fluctuation calculated for the Month / Quarter / Year.
(April 29 was built taking into account the time of publication of the article)
The volatility of the current time is 51 points, which is 40% lower than the daily average. It can be assumed that activity will remain within the normal range if the fluctuation in the range persists.
Key levels
Resistance Zones: 1.0885 *; 1.1000 ***; 1.1080 **; 1.1180; 1.1300; 1.1440; 1.1550; 1.1650 *; 1.1720 **; 1.1850 **; 1.2100
Support areas: 1.0850 **; 1.0775 *; 1.0650 (1.0636); 1,0500 ***; 1.0350 **; 1.0000 ***.
* Periodic level
** Range Level
*** Psychological level