To open long positions on EUR/USD, you need:
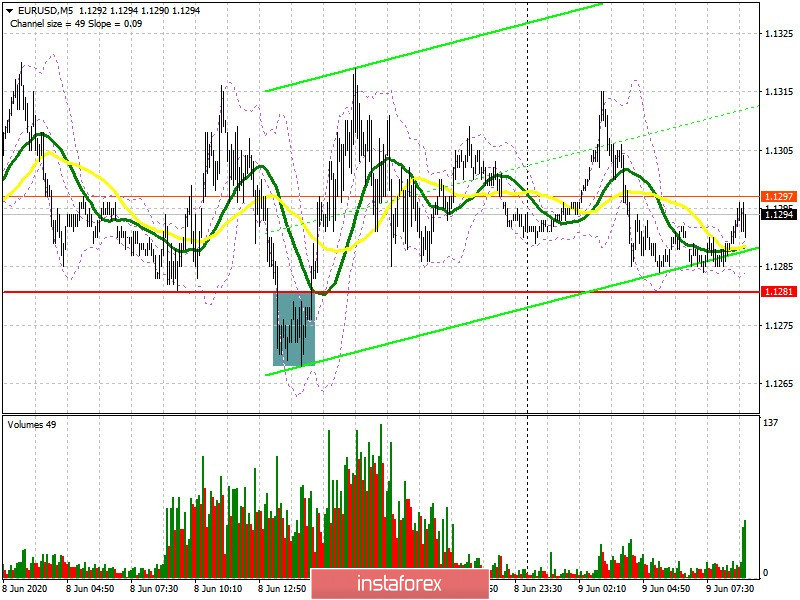
Nothing has changed in yesterday's course. In my forecast for the afternoon, I drew attention to the likelihood of a false breakout near the level of 1.1281 after the bears' unsuccessful attempt to resume the downward correction, which, in fact, happened. If you look at the 5-minute chart, you will see how the bulls regain the level of 1.1281, which results in forming a signal to buy the euro and the pair moving to the highs of the day, above which it was also not possible to break through, as a result of which a new resistance was formed there. In the Commitment of Traders (COT) reports for June 2, a decrease in both long and short positions was recorded, however, sellers left the market more, which kept the bullish momentum in the medium term. The report shows a decrease in short non-commercial positions from the level of 99,812 to the level of 93,172, while long non-commercial positions slightly decreased, from the level of 175,034 to the level of 174,412. As a result, the positive non-commercial net position increased again and reached 81,240 against 75,222, which indicates a growing interest in buying risky assets even at current prices high enough for the market. As for the intraday strategy, it has not changed in comparison with yesterday. Only the emphasized levels have changed today. Forming a false breakout in the morning in the support area of 1.1267, which can only happen after good data on the eurozone GDP, will be a signal to open long positions. However, a breakthrough and consolidation above resistance 1.1323 will be an equally important task for the bulls, which will lead to larger bullish growth in the area of a high of 1.1377, and then to renewing a large resistance at 1.1422, where I recommend taking profit. In case pressure remains on the euro, I recommend returning to long positions in EUR/USD only after updating a large support level of 1.1195, counting on a correction of 30-40 points within the day.
To open short positions on EUR/USD, you need:
Sellers have a chance to build a downward correction, since there was no particular demand for the euro when approaching yesterday's highs, even during the US session. To maintain pressure on the euro, it is necessary to break below the support level of 1.1267, the second test of which will probably happen today after the release of the eurozone GDP report for the first quarter of this year, when the economy was already in the stage of paralysis due to quarantine measures. Breakout at 1.1267 will push EUR/USD to the lows of 1.1199, and another target will be support at 1.1139, where I recommend taking profits. In addition, the bears need not to let the pair go above resistance 1.1323, where forming a false breakout will be an additional signal to open short positions. It is best to sell EUR/USD immediately on the rebound from the previous week's high near 1.1377 or immediately on the rebound from the new weekly resistance in the 1.1422 area, counting on a correction of 25-30 points within the day.
Signals of indicators:
Moving averages
Trading is carried out in the region of 30 and 50 moving average, which indicates the possible completion of the bull market.
Note: The period and prices of moving averages are considered by the author on the hourly chart H1 and differs from the general definition of the classic daily moving averages on the daily chart D1.
Bollinger bands
A break of the upper boundary of the indicator in the region of 1.1310 will lead to a new upward momentum of the pair. A break of the lower border of the indicator in the area of 1.1265 will increase pressure on the euro.
Description of indicators
- Moving average (moving average determines the current trend by smoothing out volatility and noise). Period 50. The graph is marked in yellow.
- Moving average (moving average determines the current trend by smoothing out volatility and noise). Period 30. The graph is marked in green.
- MACD indicator (Moving Average Convergence / Divergence - Moving Average Convergence / Divergence). Fast EMA period 12. Slow EMA period 26. SMA period 9.
- Bollinger Bands (Bollinger Bands). Period 20.
- Non-profit traders are speculators, such as individual traders, hedge funds and large institutions that use the futures market for speculative purposes and meet certain requirements.
- Long nonprofit positions represent the total long open position of nonprofit traders.
- Short nonprofit positions represent the total short open position of nonprofit traders.
- The total non-profit net position is the difference between the short and long positions of non-profit traders.