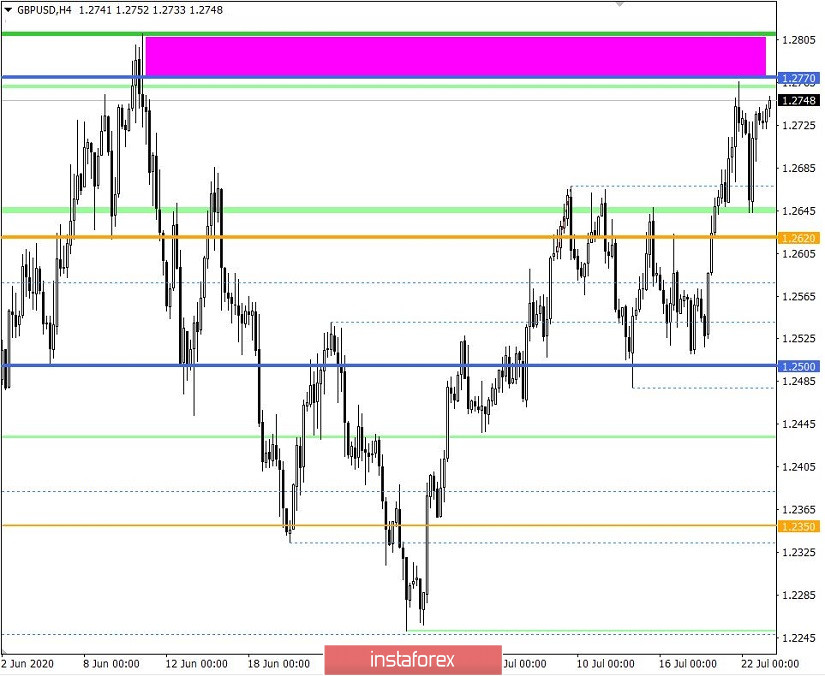
The pound/dollar pair was in the wake of speculative excitement once again, where there was a rational corrective move from the range level of 1.2770 at the beginning of the journey, towards the level of 1.2620, but after noon, the market was a seized by speculation gain, eventually returning the quote to the starting point.
The V-shaped formation on the hourly time frame indicates that the upward interest in the market remains, but the picture is different with respect to the daily period. The daily interval displays a rapid upward trend, where the overbought pound sterling does not confuse speculators who are overheated on long positions. The last candlestick on D1 has acquired the form of a "Doji", which indicates instability in the market.
In terms of market dynamics, there is a consistently high volatility indicator, which confirms the fact of speculation in the market.
The news background of the past day contained data on home sales in the secondary market of the United States, where the indicators, although they came out worse than forecasted, still reflected a recovery of + 20.7% against -9.7% in May.
There was almost no market reaction to the statistics.
The information background strengthened again the already difficult situation with the Brexit divorce proceedings. This time, The Daily Telegraph spoke with inside information, citing its high-ranking sources, claiming that the UK and the EU will not be able to conclude a free trade agreement.
According to a Telegraph source, there is currently speculation that there will be no deal. However, the newspaper notes that the possibility of reaching a basic agreement in the event that the EU makes concessions during the autumn negotiation session is still preserved.
"The UK government has long made it clear that it is prepared for no deal. England is not going to get off the ground on such main points as fishing, so everything is in the hands of the EU," the publication quotes a senior source.
Based on this background, we can understand that the pound sterling rate is now unjustifiably overvalued, and if the negotiation process on the deal does not move from the dead point, a rapid downward move will be seen.
Today, in terms of the economic calendar, we have data on the labor market in the United States, where weekly unemployment claims will be published. So, the number of initial applications should decline from 1,300,000 to 1,295,000, and repeat applications will decline from 17,338,000 to 17,100,000. The volume is still large, but there is a gradual recovery, which can positively play on the dollar.
From the point of view of a complex analysis, we see price fluctuations within a narrow range of 20-30 points, which, in turn, is in close proximity to the range level of 1.2770.
The burning forecast is that the market is falling more and more into the overheated zone every day, where the external background, which is not conducive to the strengthening of the pound, is ignored by speculators, which leads to an inertial move. Sooner or later, long positions will be fixed, which will lead to a rapid recovery relative to the upward price movement.
The technical picture has a sell signal, combining overbought, Doji candlestick pattern, as well as the nearby range level of 1.2770.
Based on the above information, we will display trading recommendations:
- Consider sell deals below the level of 1.2720, towards values 1.2650-1.2620-1.2500
- Consider buy deals if the speculative excitement does not subside and the quote manages to consolidate above the level of 1.2770, which can extend the inertia in the direction of the values 1.2810-1.2885.
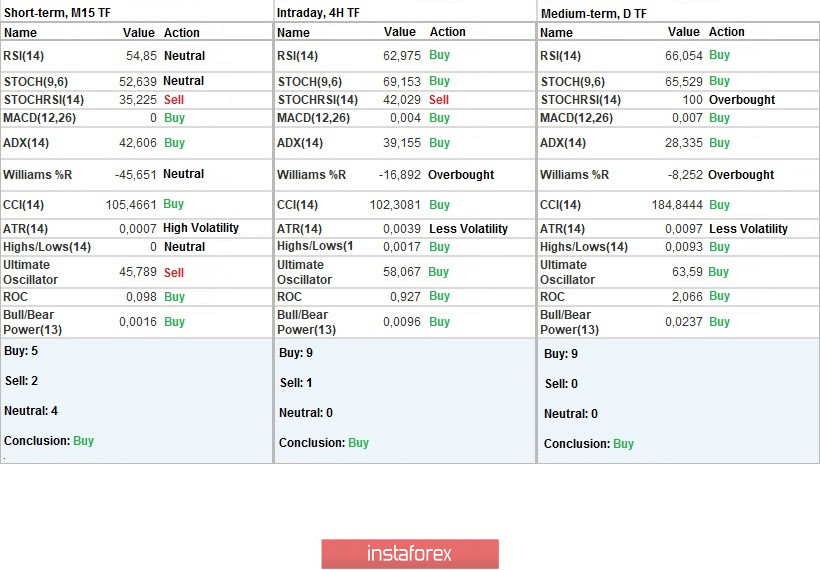
Indicator analysis
Analyzing different sectors of time frames (TF), we see that the indicators of technical instruments keep the buy signal relative to all major time periods. Concentration of the price within the range level does not make it possible to change the trading signal.
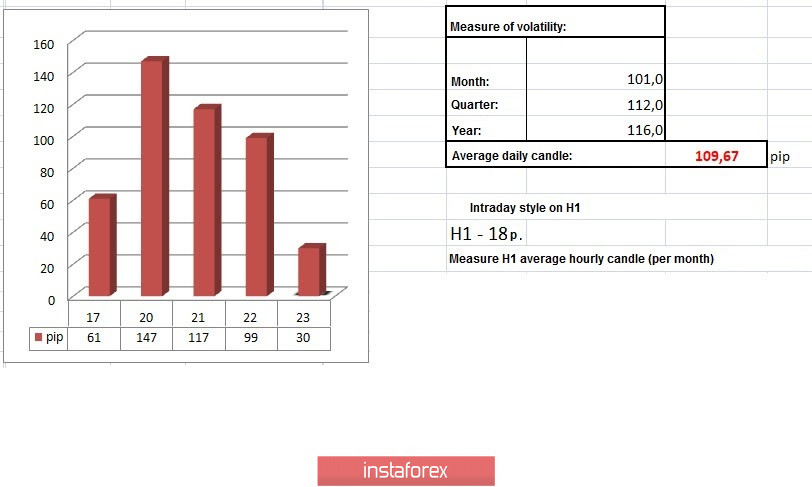
Weekly volatility / Volatility measurement: Month; Quarter; Year
Measurement of volatility reflects the average daily fluctuation, calculated per Month / Quarter / Year.
(July 23 was built taking into account the publication time of the article)
The volatility of the current time is 30 points, which is 72% below the daily average. It can be assumed that the market will move to another round of acceleration soon, where the speculative attitude will help us in this.
Key levels
Resistance zones: 1.2770 **; 1.2885 *; 1.3000; 1.3170 **; 1.3300 **; 1.3600; 1.3850; 1.4000 ***; 1.4350 **.
Support zones: 1.2620; 1.2500; 1.2350 **; 1.2250; 1.2150 **; 1.2000 *** (1.1957); 1.1850; 1.1660; 1.1450 (1.1411); 1.1300; 1.1000; 1.0800; 1.0500; 1.0000.
* Periodic level
** Range level
*** Psychological level