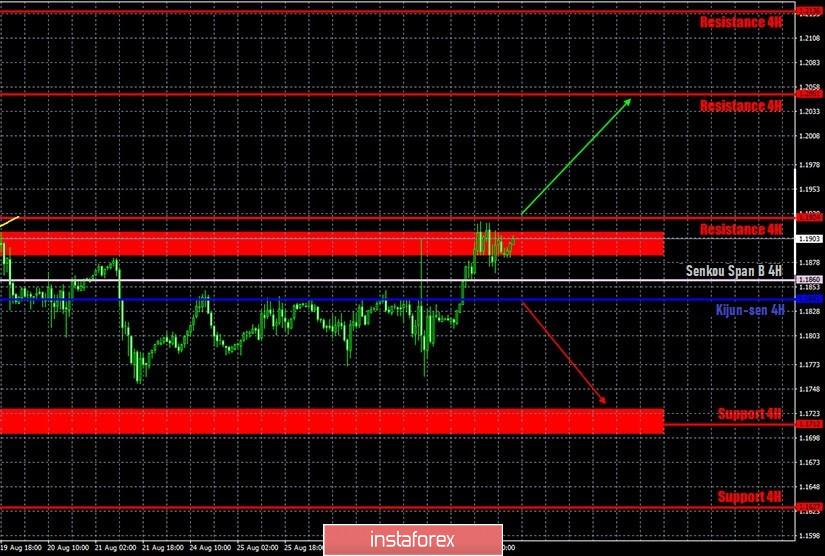
EUR/USD 1H
On the hourly timeframe on August 27, the EUR/USD pair continued the same vague movements that have been observed over the past month. The pair's quotes are also traded within the side channel, limited by the levels of $1.17 and $1.19. The price rose to the upper border of the channel – 1.1886-1.1910 area, in the final trading day of last week, however, quite predictably, it failed to overcome it. Thus, despite the euro's growth last Friday, we still cannot conclude that the upward trend has resumed. The EUR/USD pair can only resume moving up if the 1.1886-1.1910 area has been confidently overcome.
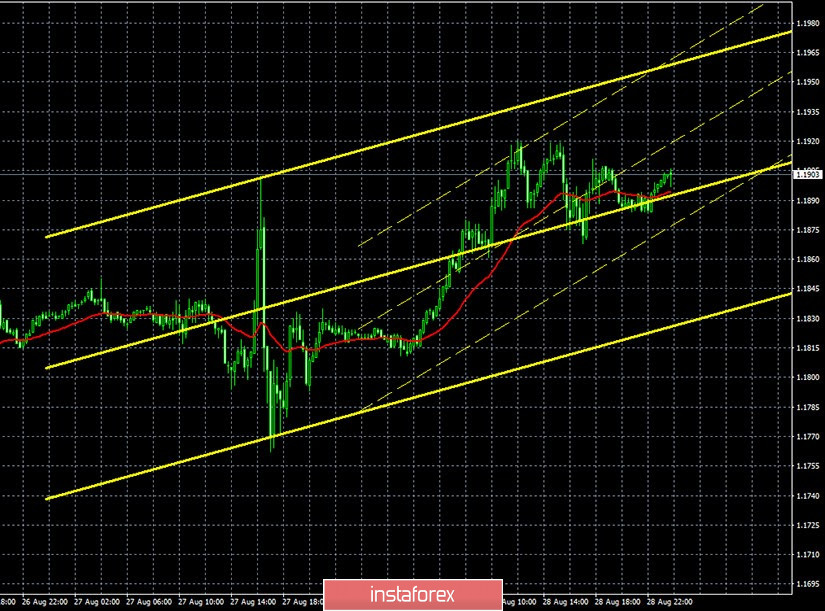
EUR/USD 15M
Both channels of linear regression moved up on the 15-minute timeframe, but in the near future they may turn down if the resistance area of 1.1886-1.1910 is not overcome. A new Commitments of Traders (COT) report was released last Friday. And take note that its character has not changed at all compared to previous COT reports. Despite the fact that the euro/dollar has been trading inside the side channel for more than a month, professional traders continue to increase their net position. In other words, the number of Buy-contracts for non-commercial traders (the most important group of traders) is growing, while the number of Sell-contracts is decreasing. The "non-commercial" category of traders opened 1,302 Buy-contracts and closed 11,310 Sell-contracts during the reporting week of August 19-25. Thus, the net position (the difference between the number of buy and sell contracts) increased by 12,000. Therefore, we can draw the same conclusions as we did a week ago and two weeks ago: professional traders continue to view the euro as a more attractive currency to invest in than the US dollar. The situation did not change during the last three trading days of the past week, which were not included in the latest COT report, as the euro currency grew again.
The fundamental background for the EUR/USD pair was quite weak. Market participants were still under the impression of Federal Reserve Chairman Jerome Powell's speech a day earlier. And although from our point of view, the Fed chief did not mention anything super-important, something that could affect monetary policy or the dollar exchange rate in the near future, nevertheless, the markets were clearly worried on Thursday and Friday, and so the dollar fell again since there was nothing optimistic in Powell's speech. There is also not much to note from the macroeconomic reports on Friday. Personal income of Americans increased by 0.4% in July, and personal expenses – by 1.9%. Although this is higher than experts' forecasts, however, these data did not provide any support to the dollar. The consumer confidence index from the University of Michigan also turned out to be better than forecasts, but also did not help the US currency in any way.
Based on the above, we have two trading ideas for August 31:
1) Bulls as a whole continue to hold the initiative in their hands. But since new long deals on the pair are opened rather reluctantly (after all, the quotes remain near the two-year highs), trading continues to proceed within the side channel. Thus, in order for the upward trend to resume, the quotes must return to the area above the range of 1.1886-1.1910. In this case, we will recommend buying the euro with the target at the resistance level of 1.2051. Take Profit in this case will be up to 110 points.
2) Bears managed to stop the victorious tread of the bulls for only a few weeks, and no more. They have not been able to start a downward trend over the past month. Thus, you can consider selling the pair while aiming for the support area of 1.1702-1.1727, if the price manages to gain a foothold below the Kijun-sen line (1.1841), however, you can see for yourself how the quotes are willingly moving down, so far not the fact that the price will reach the target area. You should be very careful with sales now. Potential Take Profit in this case is 70-80 points.
Explanations for illustrations:
Support and Resistance Levels are the levels that serve as targets when buying or selling the pair. You can place Take Profit near these levels.
Kijun-sen and Senkou Span B lines are lines of the Ichimoku indicator transferred to the hourly timeframe from the 4-hour one.
Support and resistance areas are areas from which the price has repeatedly rebounded off.
Yellow lines are trend lines, trend channels and any other technical patterns.