To open long positions on EUR/USD, you need:
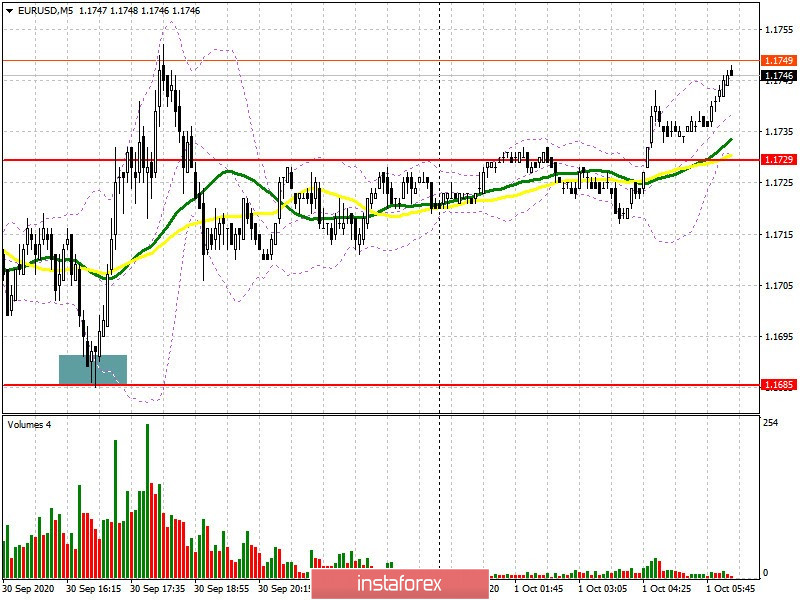
A good signal to buy the euro from the 1.1685 level appeared yesterday afternoon, which I wrote in yesterday's afternoon review. Let's figure it out. On the 5-minute chart, you can clearly see how the bulls quickly took the initiative in their own hands after testing support at 1.1685, and the statements of European Central Bank President Christine Lagarde regarding the shift in the eurozone's inflation target caused the single currency to grow, which was then picked up by the good data on the American economy. I also mentioned such a probability in yesterday's reviews.
At the moment, the nearest levels have changed. Euro buyers should prioritize a breakout and then settle above the resistance of 1.1754, which will cause EUR/USD to grow to a high of 1.1796. Thel 1.1833 level will be a distant target, where I recommend taking profits. However, it is worth paying attention to the economic calendar. The report on activity in the manufacturing sector of eurozone countries will be released today, which may have a negative impact on the euro, as the indicators have a chance to significantly slow down in early autumn this year. In this scenario, it is best to wait for a false breakout to form in the support area of 1.1713, but I recommend buying EUR/USD immediately on a rebound but only from a larger low in the 1.1668 area, counting on a correction of 20-30 points within the day.
The Commitment of Traders (COT) reports for September 22 showed that both long and short positions increased, but there were more of the first ones than the latter, which led to an increase in the delta. Apparently, buyers are attracted to such a low euro rate for the first time in three months, even despite the risk of a second wave of coronavirus infection across Europe. Thus, long non-commercial positions increased from 230,695 to 247,049, while short non-commercial positions only increased from 52,199 to the level of 56,227. The total non-commercial net position also increased over the reporting week to 190,822, against 178,576 a week earlier, which indicates bullish market sentiment in the medium term. The more the euro falls against the US dollar, the more attractive it will be for new investors.
To open short positions on EUR/USD, you need:
Sellers of the euro need to protect resistance at 1.1754, and forming a false breakout on it will be a signal to open short positions in the pair. In this case, the main target will be a low of 1.1713, consolidation below it will form an additional entry point to short positions and return the market to the bears, making it possible for them to reach the 1.1668 area, where I recommend taking profits. Support at 1.1617 will be a distant target. If there is no critical activity when resistance is being tested at 1.1754, and the eurozone data turns out to be better than economists' forecasts, then it is best not to rush to sell, but to wait for the quote to grow to a new resistance at 1.1796 and sell the euro there immediately on a rebound based on a correction of 20-30 points within the day.
Indicator signals:
Moving averages
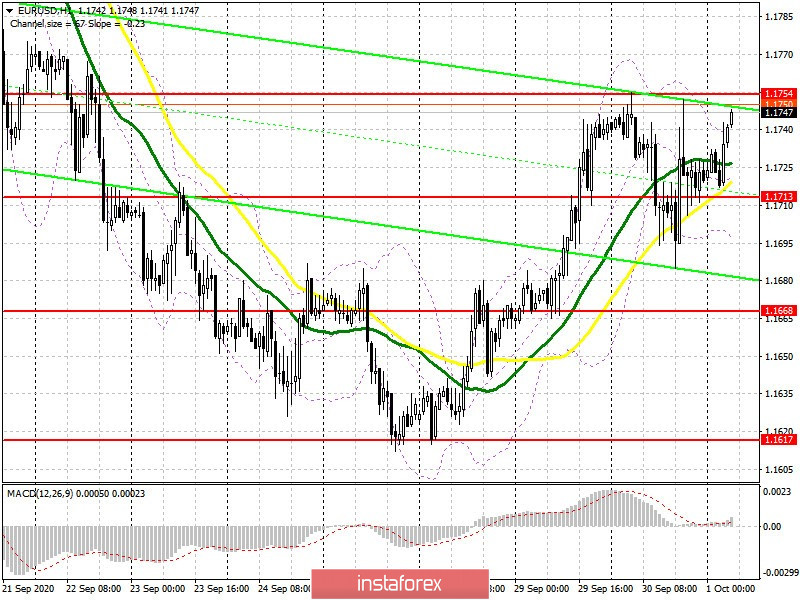
Trading is carried out above 30 and 50 moving averages, which indicates that an upward correction is about to form in the euro.
Note: The period and prices of moving averages are considered by the author on the H1 hourly chart and differs from the general definition of the classic daily moving averages on the D1 daily chart.
Bollinger Bands
The breakout of the upper border of the indicator around 1.1740 will sustain the euro's growth. In case the pair falls, support will be provided by the lower border of the indicator in the 1.1695 area.
Description of indicators
- Moving average (moving average, determines the current trend by smoothing out volatility and noise). Period 50. It is marked in yellow on the chart.
- Moving average (moving average, determines the current trend by smoothing out volatility and noise). Period 30. It is marked in green on the chart.
- MACD indicator (Moving Average Convergence/Divergence — convergence/divergence of moving averages) Quick EMA period 12. Slow EMA period to 26. SMA period 9
- Bollinger Bands (Bollinger Bands). Period 20
- Non-commercial speculative traders, such as individual traders, hedge funds, and large institutions that use the futures market for speculative purposes and meet certain requirements.
- Long non-commercial positions represent the total long open position of non-commercial traders.
- Short non-commercial positions represent the total short open position of non-commercial traders.
- Total non-commercial net position is the difference between short and long positions of non-commercial traders.