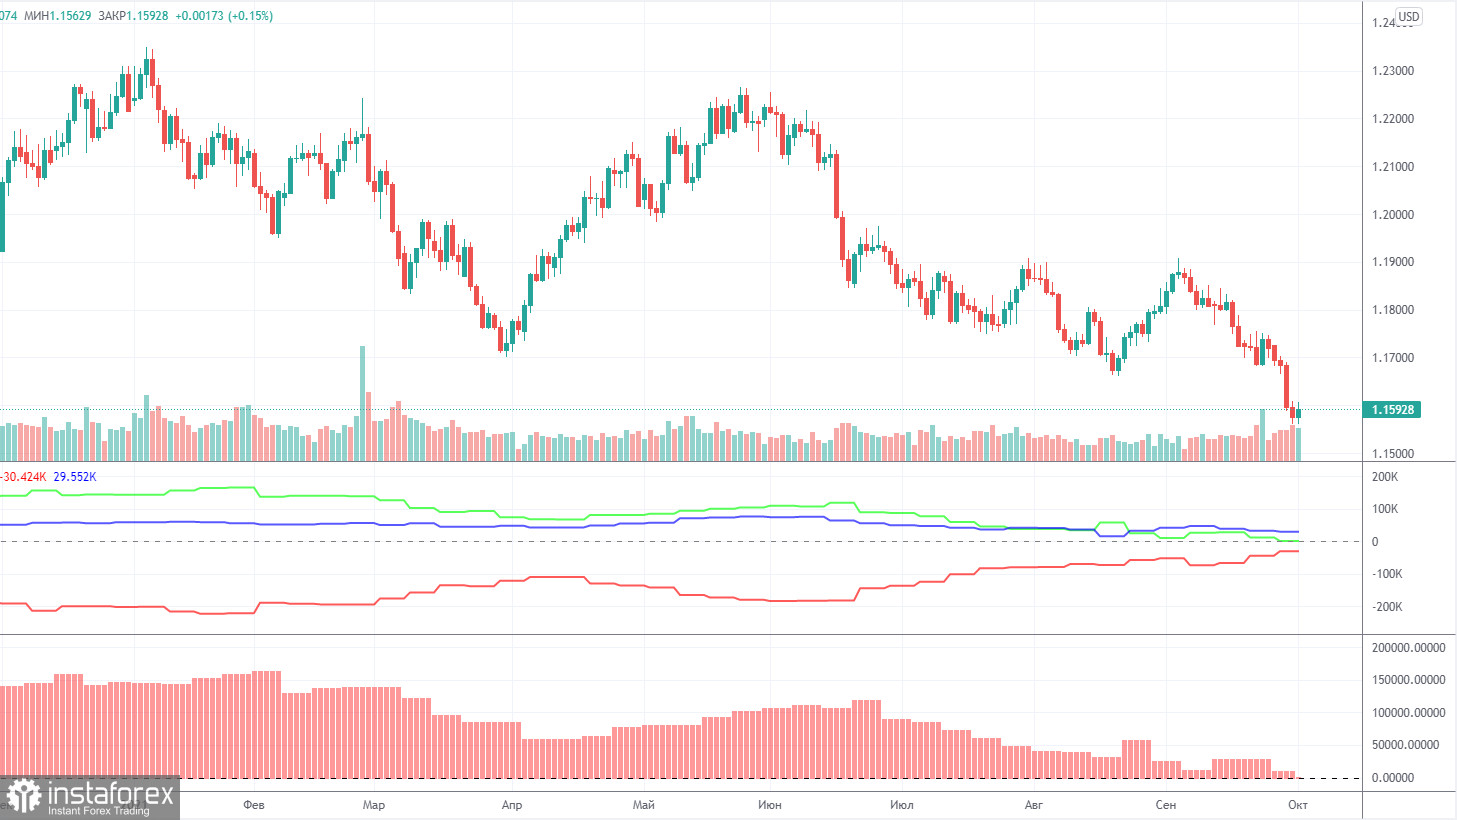
EUR/USD 5M
The EUR/USD pair decided to renew its anti-record of volatility over the past couple of years during the penultimate trading day of the week. Recall that over the past few months, the pair has been regularly traded with low volatility of about 40 points. However, a volatility of 25 points can claim to be the lowest over the past few years for sure. That is how much was passed yesterday from the low to the high of the day. It is also better to note right away that there were no macroeconomic reports (important) during the day, either in the European Union or in the United States. A report on claims for unemployment benefits in the United States has not provoked any market reaction for a long time. The European Central Bank's monetary policy report is a loud sign, but a dummy inside. And there was nothing more interesting on Thursday. By some miracle, under such introductory conditions, the pair managed to form three sell signals and at the same time did not trade in absolute flat all day. All three signals are rebounds from the extreme level of 1.1568. In the first case, the price moved down about 8 points after formation. In the second - about 15. And the third signal is no longer of interest to us, since it was formed in the evening and it was already clear to everyone exactly how the pair was moving on that day. Thus, traders could open short positions at a sell signal, which closed at a Stop Loss set at breakeven (the price went down 15 points). Consequently, traders did not receive any losses yesterday, which is just fine, given the volatility of the EUR/USD pair.
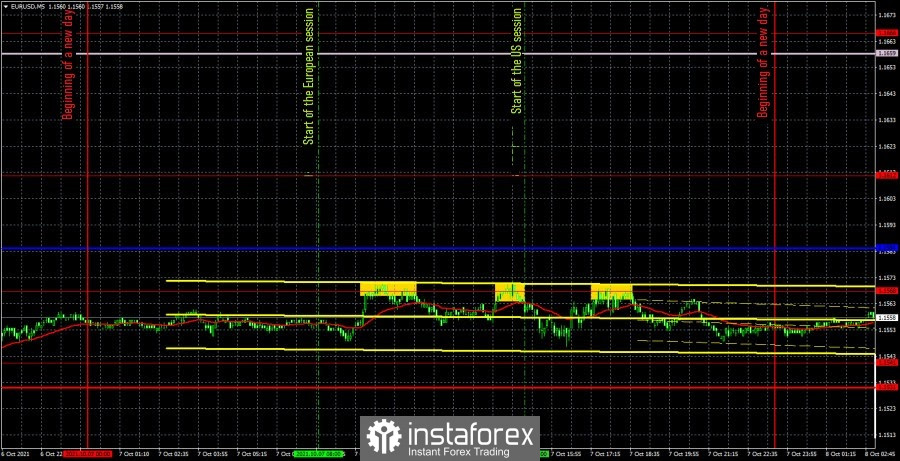
EUR/USD 1H
You can see that the euro/dollar pair continues to move down almost every day on the hourly timeframe, from time to time it rolls back up a bit. At this time, the downtrend line remains relevant, and the price continues to be below the Kijun-sen and Senkou Span B lines. Thus, all key lines signal a very likely continuation of the downward movement. Recall that the pair's downward movement has been going on for more than a month and we believe that this may be due to the markets' belief in the curtailment of the QE program in November, as well as due to the possible new financial crisis around the world, thanks to which the markets can invest in the dollar. as a reserve currency. On Friday, we highlight the following levels for trading - 1.1507, 1.1541, 1.1568, 1.1612, 1.1666, 1.1704, as well as the Senkou Span B (1.1659) and Kijun-sen (1 , 1584). The Ichimoku indicator lines can change their position during the day, which should be taken into account when looking for trading signals. Signals can be rebounds or breakthroughs of these levels and lines. Do not forget about placing a Stop Loss order at breakeven if the price moves 15 points in the right direction. This will protect you against possible losses if the signal turns out to be false. October 8 is the most important day of the week. A major report, NonFarm Payrolls, will be released in the United States, which may cause a strong market reaction. In addition, ECB President Christine Lagarde's speech and the publication of the US unemployment rate for September will take place. In the case of Lagarde, everything will depend on what exactly Lagarde says. Recall that all of her recent speeches did not cause any reaction from traders. But the reaction to the Nonfarm report will be with a probability of 99%.
We also recommend that you familiarize yourself with the forecast and trading signals for the GBP/USD pair.
COT report
The mood of non-commercial traders became "less bullish" again during the last reporting week (September 21-27). And in the near future it may become fully bearish, because at the moment the number of buy and sell contracts for major players is practically the same. This means that the mood is "neutral" at this time, but this word does not accurately reflect what is happening in the market. According to the mood of professional traders, there is now a clear down trend. Thus, the mood is not "neutral". During the reporting week, the non-commercial group opened 7,000 buy contracts (longs) and 16,000 sell contracts (shorts). Thus, the net position decreased by 9,000. This is exactly what we talked about in the previous paragraph: traders at this time are actively getting rid of the euro currency, and, accordingly, buy the US dollar. Thus, at this time, the readings of the COT reports and the movement of the EUR/USD pair have a correlation. However, there are two important points to keep in mind. First, the Federal Reserve has not yet begun to roll back its QE. The second - the current downward movement - is still a correction against the global upward trend, in which the pair has been for a year and a half. Thus, the "foundation" and the COT reports give us the opportunity to assume that the euro will continue to fall. But, recall, each hypothesis and assumption must be confirmed by specific technical signals. Now these signals are there.
Explanations for the chart:
Support and Resistance Levels are the levels that serve as targets when buying or selling the pair. You can place Take Profit near these levels.
Kijun-sen and Senkou Span B lines are lines of the Ichimoku indicator transferred to the hourly timeframe from the 4-hour one.
Support and resistance areas are areas from which the price has repeatedly rebounded off.
Yellow lines are trend lines, trend channels and any other technical patterns.
Indicator 1 on the COT charts is the size of the net position of each category of traders.
Indicator 2 on the COT charts is the size of the net position for the non-commercial group.