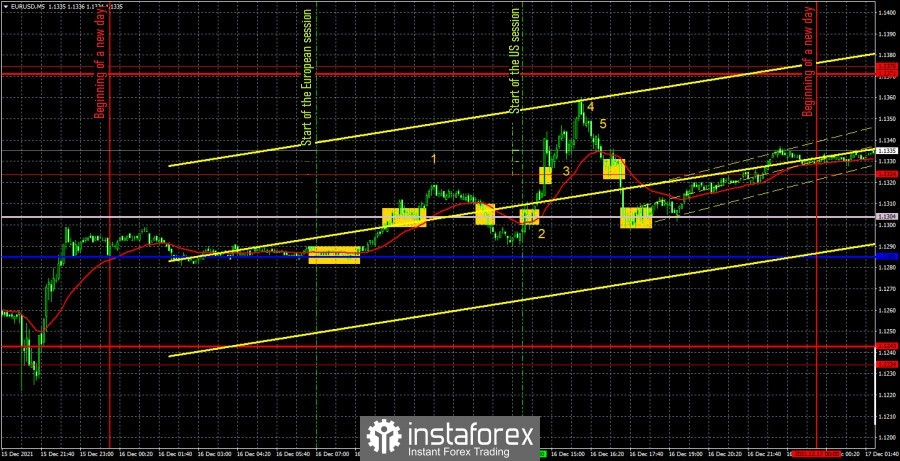
EUR/USD 5M

The EUR/USD pair showed volatility equal to 80 points on Thursday. However, look at the movements themselves during the day. The pair changed direction several times. If it has been growing since the morning (the Europeans worked out the results of the Federal Reserve meeting), then before the announcement of the results of the ECB meeting it decreased, then again showed good growth, and after working out the results it began to fall no less strongly. That is, by and large, at this time the euro is only a few dozen points above the levels before the meetings of the Federal Reserve and the ECB. And this means that there were no special changes in the technical picture, except that the pair traded with increased volatility for a whole day. Although on closer examination, this indicator does not cause any special emotions. On Thursday, in addition to the ECB meeting, there were also macroeconomic publications in the United States and the European Union. In particular, business activity indices in the service and manufacturing sectors were published. And if in the US these reports turned out to be decent, then in the European Union they were weak. Therefore, the euro currency could fall in the second half of the European session after data was released (figure "1" in the chart). The number "2" marks the time when the ECB results were released and it is not surprising that we see a strong movement at this point in the chart . All other reports did not provoke any reaction from traders. It can hardly be said that data on industrial production or business activity indices led to a 55-point drop in the second half of the US session, as these reports were worse than forecasts. It remains only to deal with trading signals during the day. The first buy signal was formed when the pair bounced off the critical line. Long positions on this signal could be opened. Subsequently, the price overcame the Senkou Span B line and only closed below this line closer to the greenback, where it was necessary to leave long positions in profit of about 10 points. The next buy signal could be worked out, but only with a Stop Loss, since half an hour after its formation, the summing up of the ECB meeting began. The risk was justified and traders could earn several dozen points on this transaction. But the pair could not get to the level of 1.1371, where it would be possible to close the deal, and by the end of the day it completely returned to the Senkou Span B. It was still possible to work out a sell signal near the level of 1.1324, but it turns out that all the trading transactions of the day brought 10-20 points of profit, no more. Nevertheless, there was not a single unprofitable transaction.
EUR/USD 1H
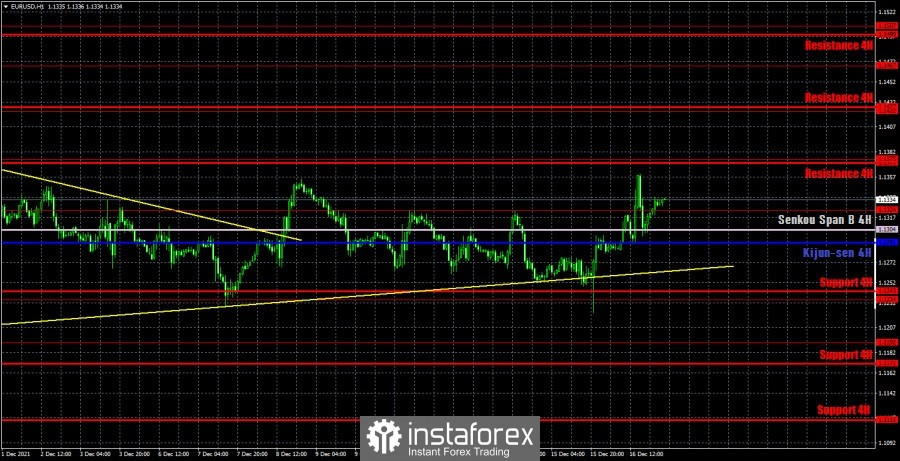
On the hourly timeframe, it is even better to see that the pair, by and large, remained inside a weak upward trend. The upward trend line remains, but at the same time, the pair is still struggling to move up. Thus, I absolutely do not exclude the option in which the downward movement will resume. We highlight the following levels for trading on Friday - 1.1192, 1.1234, 1.1324, 1.1375, as well as the Senkou Span B (1.1304) and Kijun-sen (1.1291) lines. The lines of the Ichimoku indicator may change their position during the day, which should be taken into account when searching for trading signals. Signals can be "rebounds" and "breakthroughs" of these levels and lines. Do not forget about placing a Stop Loss order at breakeven if the price moves 15 points in the right direction. This will protect you against possible losses if the signal turns out to be false. The European Union will re-publish the consumer price index for November, and in the United States - nothing. Thus, the fundamental and macroeconomic background will be absent today. Therefore, we can expect a decrease in volatility and calm movements of the pair.
We recommend you to familiarize yourself:
Overview of the EUR/USD pair. December 17. Predictable Fed and passive ECB.
Overview of the GBP/USD pair. December 17. An unexpected expected surprise from the Bank of England.
Forecast and trading signals for GBP/USD for December 17. Detailed analysis of the movement of the pair and trade deals.
Analysis of the COT report
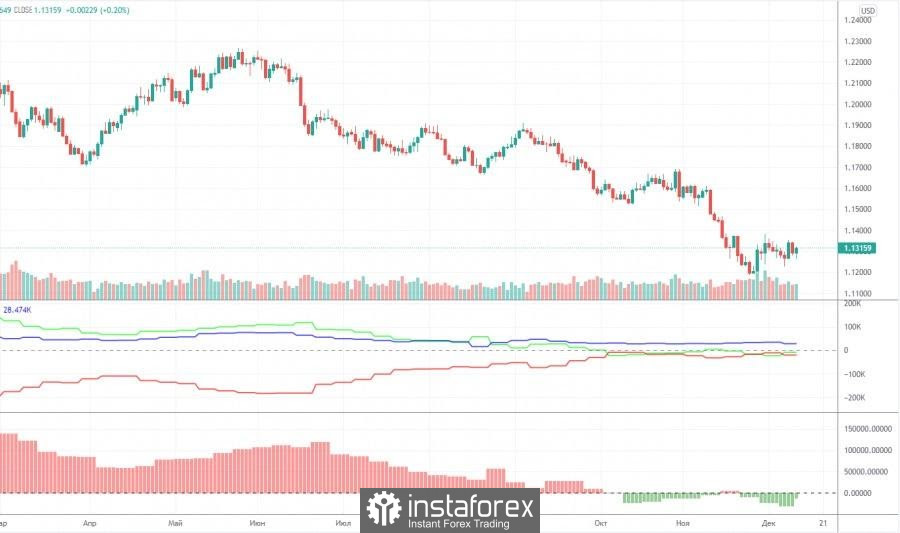
The mood of non-commercial traders became... less bearish again during the last reporting week (November 30 – December 6). What does it mean? This means that the group of "non-commercial" traders now has more open short positions than long ones, but at the same time, the number of sell contracts (shorts) has decreased over the past week. To be precise, it decreased by 15,000, and the number of longs increased by 2,000. Thus, the net position of professional players increased by 17,000, respectively, the bearish mood became less strong. However, it was not strong, and the trend is important to us first of all. And that's just with the trend lately, everything is bad... The fact is (and it is perfectly noticeable in the chart above) that the green and red lines (net positions of non-commercial and commercial traders) have been tightly stuck near the zero level in recent months. This means that now the mood of both groups of traders is as neutral as possible. Nevertheless, all this time the European currency continues to fall, which already looks like a correlation between the actions of major market participants and the movement of the euro exchange rate. So far, this can be attributed to chance, but the bearish mood in the euro has not intensified in recent weeks and months. Thus, it is impossible to say that major players continue to get rid of the euro currency. From this point of view, it can be assumed that the downward trend is nearing its end, but at the same time you should wait for strong technical signals to start opening long positions.
Explanations for the chart:
Support and Resistance Levels are the levels that serve as targets when buying or selling the pair. You can place Take Profit near these levels.
Kijun-sen and Senkou Span B lines are lines of the Ichimoku indicator transferred to the hourly timeframe from the 4-hour one.
Support and resistance areas are areas from which the price has repeatedly rebounded off.
Yellow lines are trend lines, trend channels and any other technical patterns.
Indicator 1 on the COT charts is the size of the net position of each category of traders.
Indicator 2 on the COT charts is the size of the net position for the non-commercial group.