Details of the economic calendar from May 17
Data on the labor market in the UK came out much better than forecasts. The unemployment rate fell from 3.8% to 3.7%, while employment in the country increased by 83,000. The change in the number of applications for unemployment benefits in April decreased by 56,900.
In total, the UK labor market stimulated the British currency to further growth.
In Europe, the second estimate of GDP for the first quarter was published, which reflected an acceleration in economic growth from 4.7% to 5.1%. The figures were ahead of the first estimate, which was 5.0%.
The European currency positively welcomed the GDP data by further strengthening its positions.
During the American trading session, data on retail sales in the United States were published, where forecasts diverged. Growth rates were expected to slow down from 6.9% to 4.2%, but instead, the previous indicator was revised in favor of growth from 6.9% to 7.34%, and the current one reflected 8.19%. As a result, the US dollar received support from the statistical data.
Analysis of trading charts from May 17
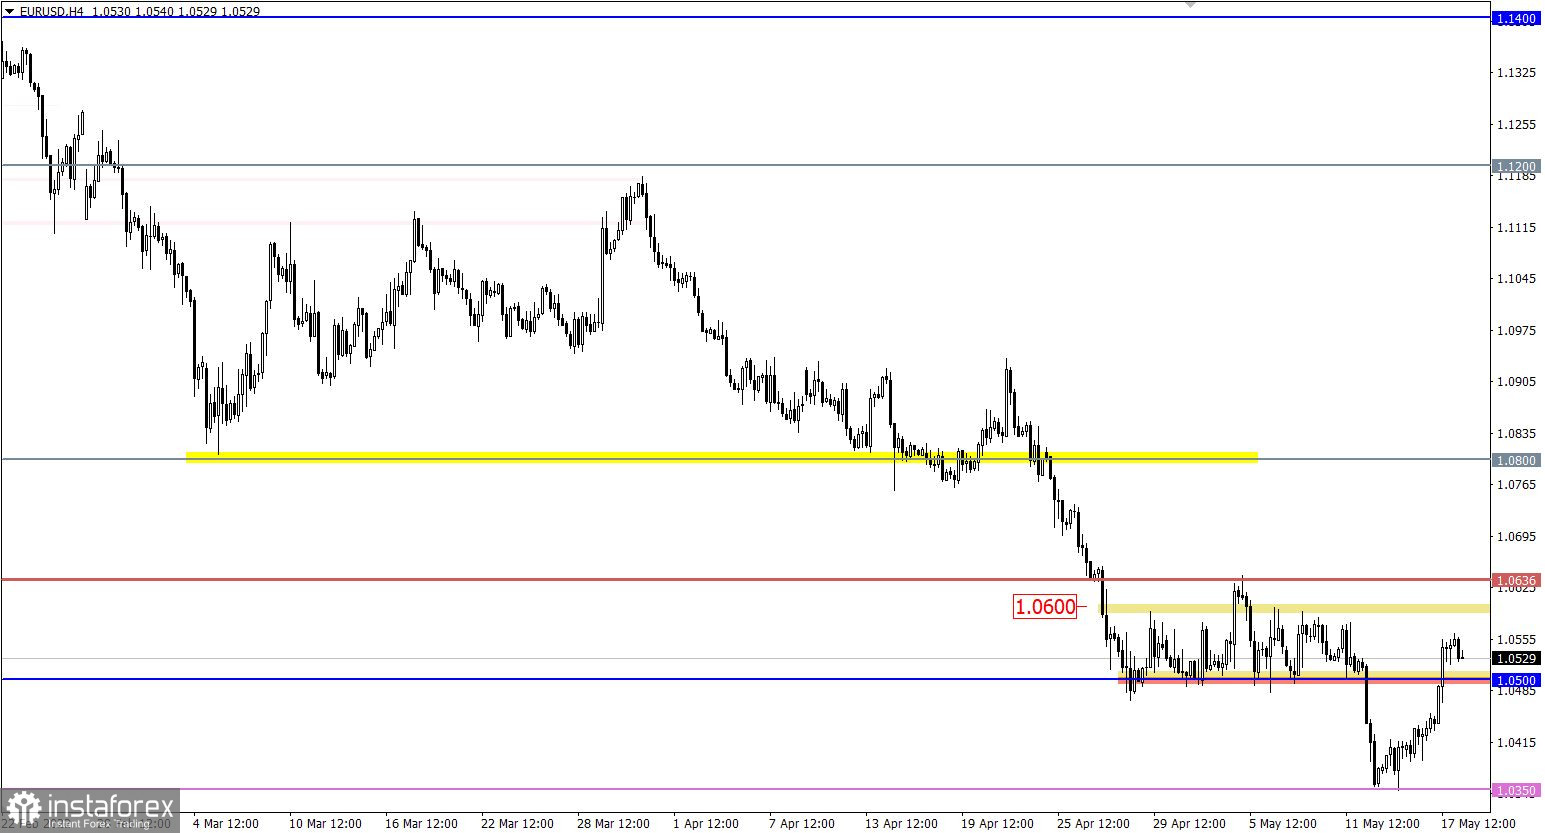
The EURUSD currency pair, during a full-scale correction, returned the quote to the boundaries of the previously passed flat 1.0500/1.0600. This movement led to a partial recovery of the euro, removing its oversold status.
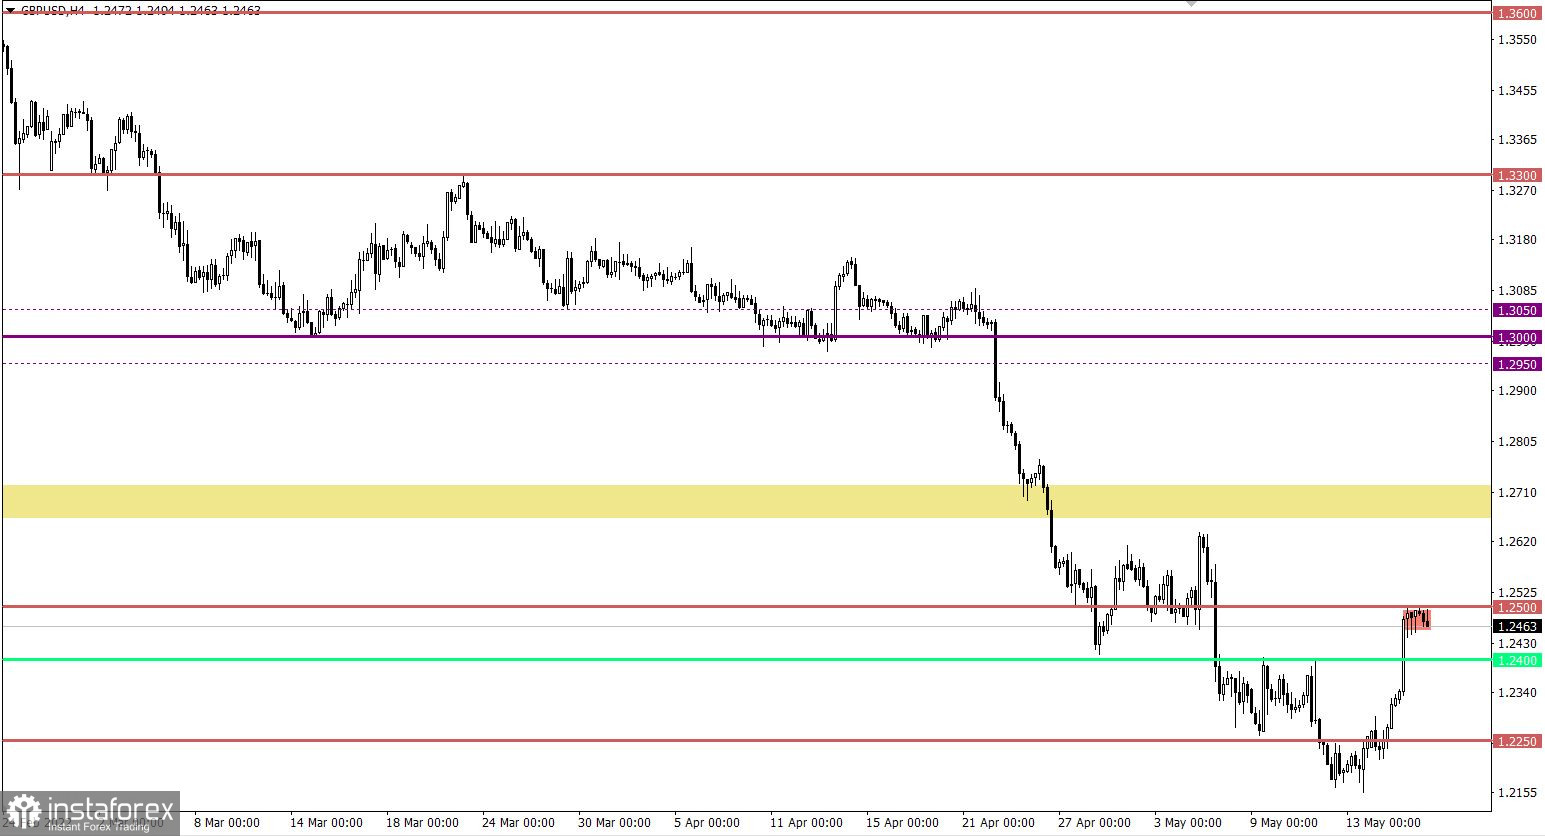
The GBPUSD currency pair formed a correction by more than 300 points, eventually returning the quote to the level of 1.2500. The subsequent price slowdown indicates an overheating of long positions.
Economic calendar for May 18
Today, with the opening of the European session, data on inflation in the UK were published, which soared from 7.0% to 9.0%. Thus, all the efforts of the Bank of England aimed at combating rising inflation have not brought any results. This is a negative factor that can put pressure on the pound sterling.
Inflation data in Europe is also expected, which is assumed to remain unchanged and coincide with the preliminary estimate. Thus, the market will not see anything new, since the data has already been taken into account in the quote.
During the American trading session, data on the construction sector will be published. The decline in its figure will not be the best factor for the economy.
Time targeting
EU Inflation - 09:00 UTC
US Building Permits Issued (Apr) - 12:30 UTC
US New Home Construction (Apr.) - 12:30 UTC
Trading plan for EUR/USD on May 18In this situation, overheating of long positions in the short term can lead to a slowdown in the corrective move. This, in turn, will attract the attention of speculators, who will increase the volume of dollar positions. The signal to sell the euro may occur when the price returns below the level of 1.0500 in a four-hour period.
At the same time, traders assume that the quotes will temporarily be clamped within 1.0500/1.0600. This movement will lead to a process of accumulation of trading forces.
Trading plan for GBP/USD on May 18
Price stagnation within the level of 1.2500 signals the process of accumulation of trading forces. It will end soon and lead to subsequent price spikes.
Assuming that the correction is coming to an end, then holding the price below 1.2420 will lead to a full rebound of the price from the level of 1.2500. This move will in turn restart short positions.
An alternative scenario sees the current slump as an opportunity for a realignment of trading forces that would remove the overbought status from the pound. In this case, holding the price above 1.2520 in a four-hour period allows for the subsequent formation of a corrective move.
What is reflected in the trading charts?
A candlestick chart view is graphical rectangles of white and black light, with sticks on top and bottom. When analyzing each candle in detail, you will see its characteristics of a relative period: the opening price, closing price, and maximum and minimum prices.
Horizontal levels are price coordinates, relative to which a stop or a price reversal may occur. These levels are called support and resistance in the market.
Circles and rectangles are highlighted examples where the price of the story unfolded. This color selection indicates horizontal lines that may put pressure on the quote in the future.
The up/down arrows are the reference points of the possible price direction in the future.