empty
 
 
23.05.2022 12:36 PM
USD/JPY analysis and forecast for May 23, 2022

Trend reversal looks highly likely

Last Friday, Haruhiko Kuroda, the Governor of the Bank of Japan, confirmed the intention of the regulator to keep loosening the monetary policy. The governor considers inflationary risks to be minimal and not serious enough to adjust the monetary policy of the Bank of Japan. The main task for the regulator today is to control the yield curve and to buy unlimited amounts of government bonds. Therefore, the almost zero yield of Japanese government bonds should remain the same. Amid the lack of macroeconomic news last week, the USD/JPY pair traded under the market sentiment shaped by covid lockdowns in China and the Russia-Ukraine conflict. In general, market optimism was low as the above-mentioned factors may trigger a recession, which worries investors. Of course, technical factors also played their role. Let's have a look at the technical picture of the pair.

Weekly chart

This image is no longer relevant

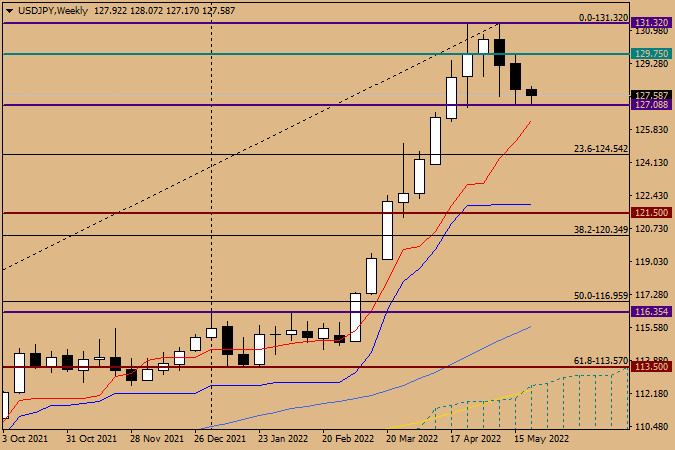
First, let's analyze USD/JPY on the weekly time frame. Last week, I assumed that the pair had completed growth and would soon turn to the downside, at least for a correction. So, my forecast for the week of May 16-20 was right. The most that the bulls managed to do was to push the quote to 129.75. They even failed to test the key historical and psychological level of 130.00. At the same time, the pair found strong support near another significant level of 127.00. As you can clearly see on the chart, the price rebounded from 127.08 and closed the week at 127.90. Today, the usd/jpy bears have tested support when approaching the previous lows and initiated a rebound. In case of a true breakout of the 127.00 level and the close of the weekly trade below this mark, the pair will drop to the red Tenkan line of the Ichimoku Indicator located at 126.31. This can easily happen this week if market conditions allow. To regain control, the USD/JPY bulls need to retest the previous high of 129.75 and close the weekly session above this level. It is even better to finish the weekly session above the significant level of 130.00.

Daily chart

This image is no longer relevant

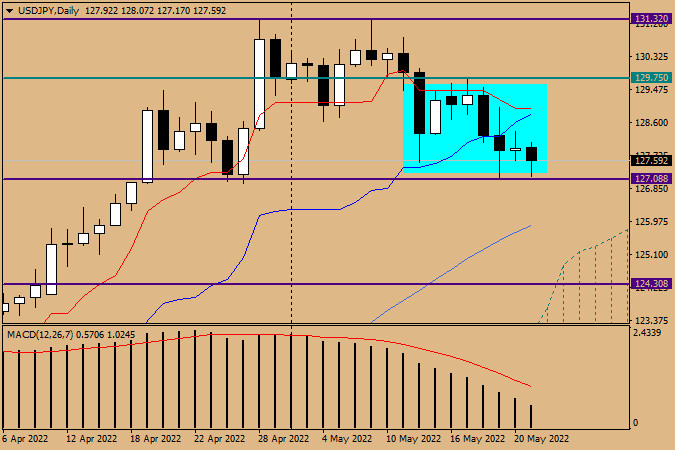
On the daily chart, we can clearly see the narrow sideways channel where the dollar/yen pair is trading at the moment. In my opinion, the direction of the price after leaving the range of 129.75-127.08 will determine the further trajectory of the pair. Given the reversal candlestick patterns on the weekly chart, as well as the fact that the Tenkan and Kijun lines are located right below the strong technical level of 129.00, I recommend selling the pair from the price area of 128.80-129.00. At the same time, reversal candlestick patterns may also appear in the above-mentioned zone on lower time frames. I wouldn't recommend buying the pair now as the reversal of the trend is highly likely.

Good luck!

Ivan Aleksandrov,
Analytical expert of InstaForex
© 2007-2024
Earn on cryptocurrency rate changes with InstaForex
Download MetaTrader 4 and open your first trade
  • Grand Choice
    Contest by
    InstaForex
    InstaForex always strives to help you
    fulfill your biggest dreams.
    JOIN CONTEST
  • Chancy Deposit
    Deposit your account with $3,000 and get $9000 more!
    In May we raffle $9000 within the Chancy Deposit campaign!
    Get a chance to win by depositing $3,000 to a trading account. Having fulfilled this condition, you become a campaign participant.
    JOIN CONTEST
  • Trade Wise, Win Device
    Top up your account with at least $500, sign up for the contest, and get a chance to win mobile devices.
    JOIN CONTEST
  • 100% Bonus
    Your unique opportunity to get a 100% bonus on your deposit
    GET BONUS
  • 55% Bonus
    Apply for a 55% bonus on your every deposit
    GET BONUS
  • 30% Bonus
    Receive a 30% bonus every time you top up your account
    GET BONUS

Recommended Stories

Can't speak right now?
Ask your question in the chat.
Widget callback