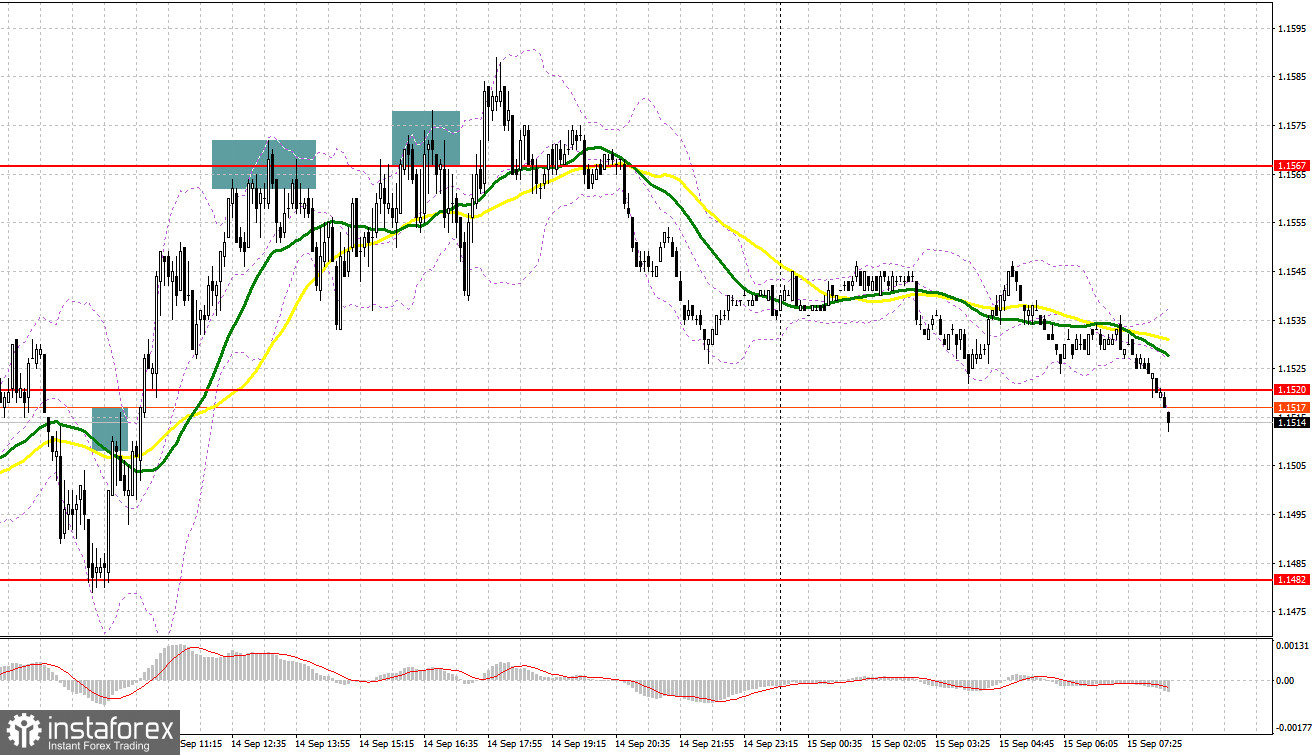
Several good market entry signals were formed yesterday. Let's take a look at the 5-minute chart and see what happened. I paid attention to the 1.1509 level and the 1.1561 level in my morning forecast and advised making decisions on entering the market. As a result of a breakthrough of 1.1509 and a reverse downward test, a good signal was formed in continuation of the bear market, but alas, the pair did not fall further. The latest data on UK inflation pushed the pound to rise closer to the middle of the day, after which the bears defended 1.1561, which formed a sell signal. As a result, the downward movement was about 30 points. The bears also defended the new resistance at 1.1567 several times in the afternoon, which provided excellent market entry points.
When to go long on GBP/USD:
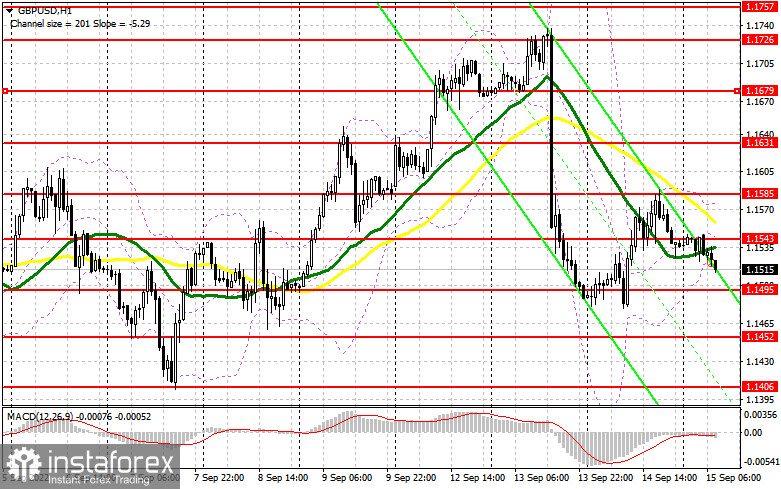
Slower inflation in the UK made it possible for the British pound to slightly correct yesterday, but the fact that it is at a double-digit level will not allow us to expect that the Bank of England will abandon its overly aggressive monetary policy in the near future, which in the current environment creates quite serious problems for the economy and puts pressure on the pound. For this reason, I advise you not to rush into long positions. Taking into account that there are no fundamental statistics on the UK today, the most convenient scenario for opening longs will be a false breakout in the area of the nearest support at 1.1495, formed on the basis of yesterday. In this case, the goal to recovery will be 1.1543, where the moving averages are, playing on the bears' side. A breakthrough and test of this range could pull speculators' stops in its wake, creating a new buy signal on the rise to the more distant 1.1585 level, allowing the bulls to stop the bear market and move trading into a horizontal channel. The farthest target will be the area of 1.1631, where I recommend taking profits.
In case the GBP/USD falls and there are no bulls at 1.1495, the pair will be under pressure again, which will open up the prospect of updating the September low. In this case, I advise you to postpone longs until the next support at 1.1452. I recommend opening longs on GBP/USD immediately for a rebound from 1.1406, or even lower - around 1.1358, counting on correcting 30-35 points within the day.
When to go short on GBP/USD:
The bears have regained control of the market and now it is very important to cling to the nearest support at 1.1495. But you also need to think about how not to release the pair above 1.1543, where the moving averages are located - if you miss this level, you can quickly lose the initiative. The optimal scenario for opening short positions on GBP/USD would be forming a false breakout in the area of 1.1543, the growth to which may occur in the first half of the day, by analogy with yesterday. This will lead to a sell signal with the goal of returning to the 1.1495 area. In order to seriously declare themselves and build a new bear market, bears need a breakdown and test of 1.1495, which will provide a good entry point for shorts with a fall to the level of 1.1452. The farthest target will be the area of 1.1406, where I recommend taking profits.
In case GBP/USD grows and the bears are not active at 1.1543, the pound could sharply rise, which creates a chance for an upward correction. Only a false breakout near the next resistance at 1.1585 will provide an entry point to short positions, hoping that the pair moves downward. If traders are not active there, I advise you to sell GBP/USD immediately for a rebound from 1.1631, counting on the pair's rebound down by 30-35 points within the day.
COT report:
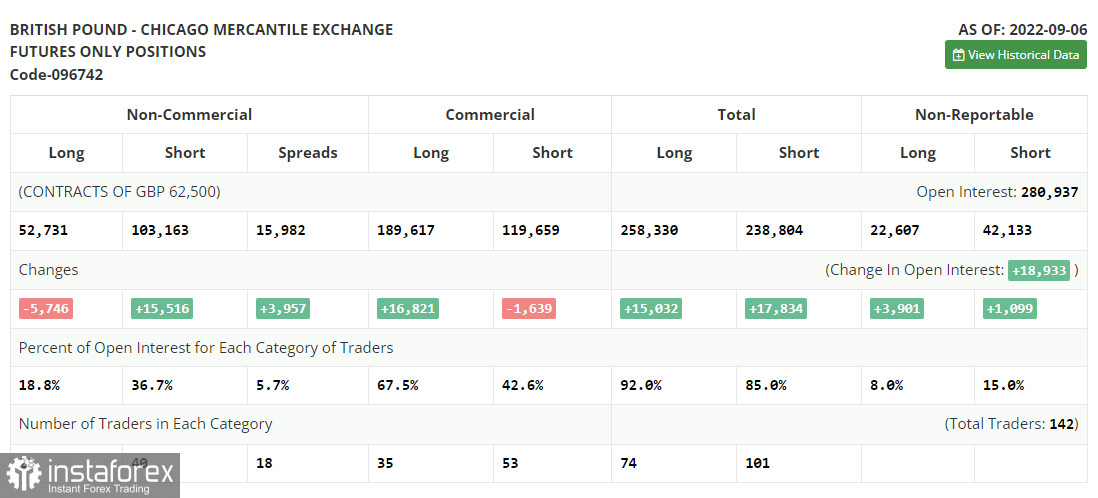
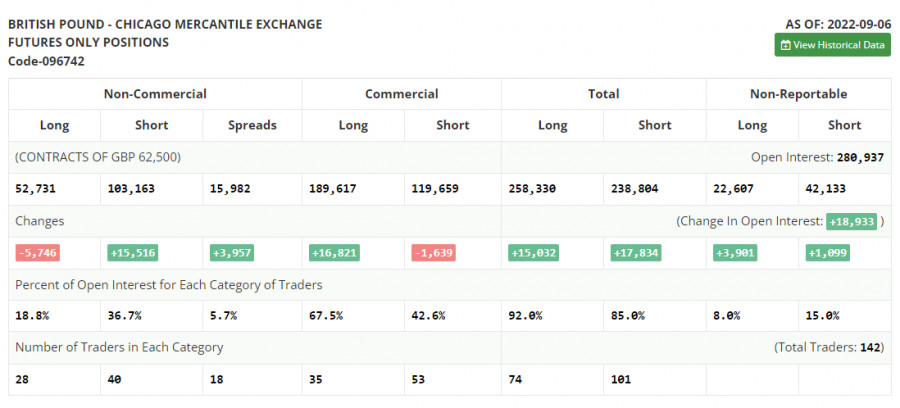
An increase in short positions and a decrease in long ones were recorded in the Commitment of Traders (COT) report for September 6. This once again confirms the fact that the British pound is in a major downward peak, from which it is not as easy to get out as it might seem. Last week, Bank of England Governor Andrew Bailey made a speech, who did his best to inspire confidence that the central bank will continue to follow the path of defeating inflation and continue to aggressively raise interest rates. This suggests that at its next meeting the committee will probably raise rates by 0.75% at once, following the example of other central banks. However, the UK economy is getting worse and worse, and GDP is shrinking quite quickly, as evidenced by recent reports, which does not give confidence to investors. With high inflation and a looming cost-of-living crisis in the UK, it will be quite difficult for bulls to get room to take long positions as nothing good is in store for the stats ahead. The latest COT report indicated that long non-commercial positions decreased by 5,746 to 52,731, while short non-commercial positions rose by 15,516 to 103,163, which led to an increase in the negative value of the non-commercial net position to -50,423 versus -29,170. The weekly closing price collapsed from 1.1526 against 1.1661.
Indicator signals:
Trading is below the 30 and 50-day moving averages, indicating a resumption of the bear market.
Moving averages
Note: The period and prices of moving averages are considered by the author on the H1 hourly chart and differs from the general definition of the classic daily moving averages on the daily D1 chart.
Bollinger Bands
In case the pair falls, the lower border of the indicator around 1.1510 will act as support. In case of growth, the upper border of the indicator around 1.1570 will act as resistance.
Description of indicators
- Moving average (moving average, determines the current trend by smoothing out volatility and noise). Period 50. It is marked in yellow on the chart.
- Moving average (moving average, determines the current trend by smoothing out volatility and noise). Period 30. It is marked in green on the chart.
- MACD indicator (Moving Average Convergence/Divergence — convergence/divergence of moving averages) Quick EMA period 12. Slow EMA period to 26. SMA period 9
- Bollinger Bands (Bollinger Bands). Period 20
- Non-commercial speculative traders, such as individual traders, hedge funds, and large institutions that use the futures market for speculative purposes and meet certain requirements.
- Long non-commercial positions represent the total long open position of non-commercial traders.
- Short non-commercial positions represent the total short open position of non-commercial traders.
- Total non-commercial net position is the difference between short and long positions of non-commercial traders.