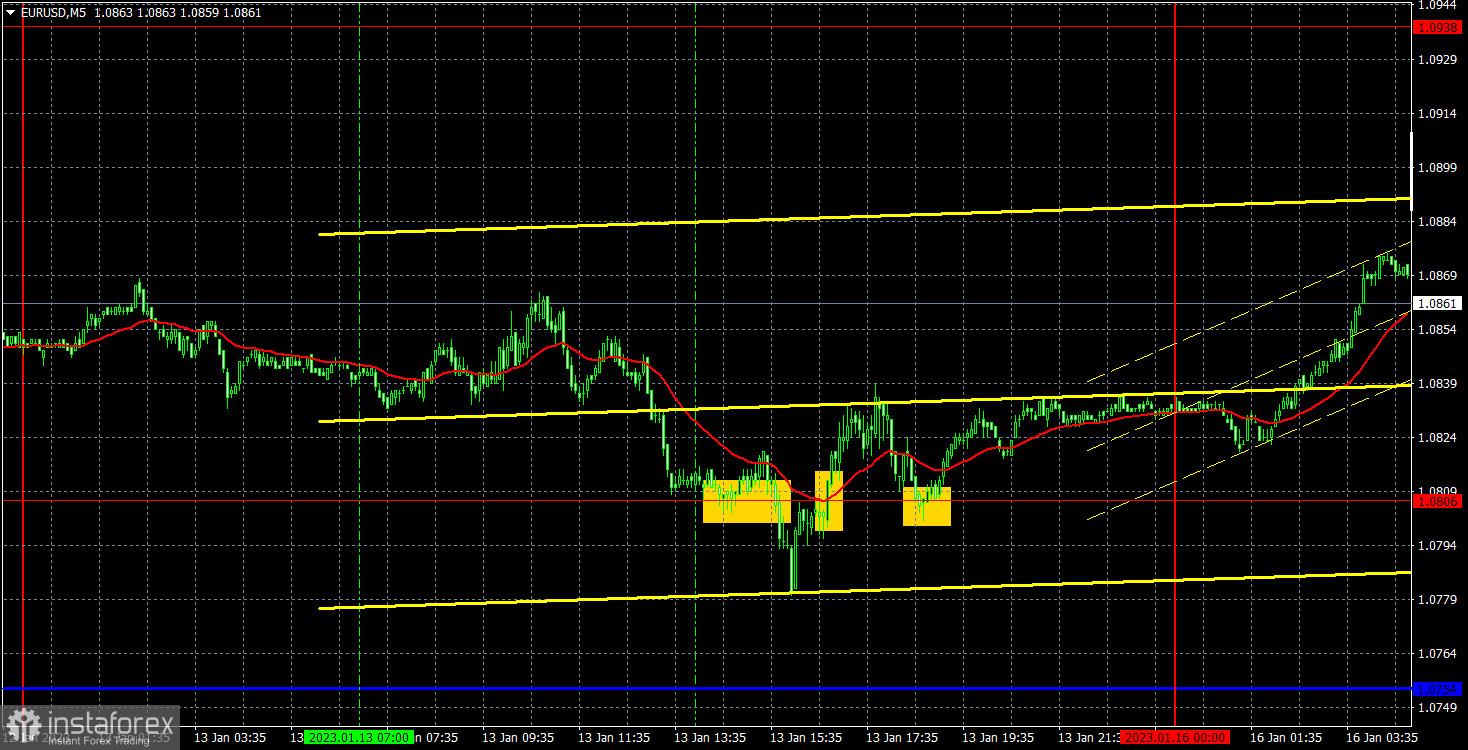
M5 chart of EUR/USD
On Friday, EUR/USD corrected to the critical line, bounced from it perfectly, and then resumed the upward movement. The euro grew, though volatility often drops on Mondays, and trend movements are rare at the Asian trading sessions. But as we can see, the market is still set to buy the pair, so there are no sell signals, and the uptrend is unquestionable. On Friday, the EU released a report on industrial production, which can hardly be considered as important. The index rose by 1% as of the end of November, but market participants preferred to ignore it. And why should the euro need any help now, if it is constantly growing? The report on consumer sentiment from the University of Michigan was published in the US in the afternoon, which rose by as much as 5 points, but the dollar got no support from the market. Thus, the picture of the current situation has not changed at all.
Friday's trading signals were very bad. If there was an intraday trending movement at the European trading session, then there was none of the kind at the US session (when all the signals were formed). The signals were formed near 1.0806, and traders could try to use only the first two. In both cases, the price was able to pass in the right direction by more than 15 points, so Stop Loss at breakeven should have been set on both trades. Consequently, neither profit nor loss was made on Friday, which is not too bad, given the nature of the movement.
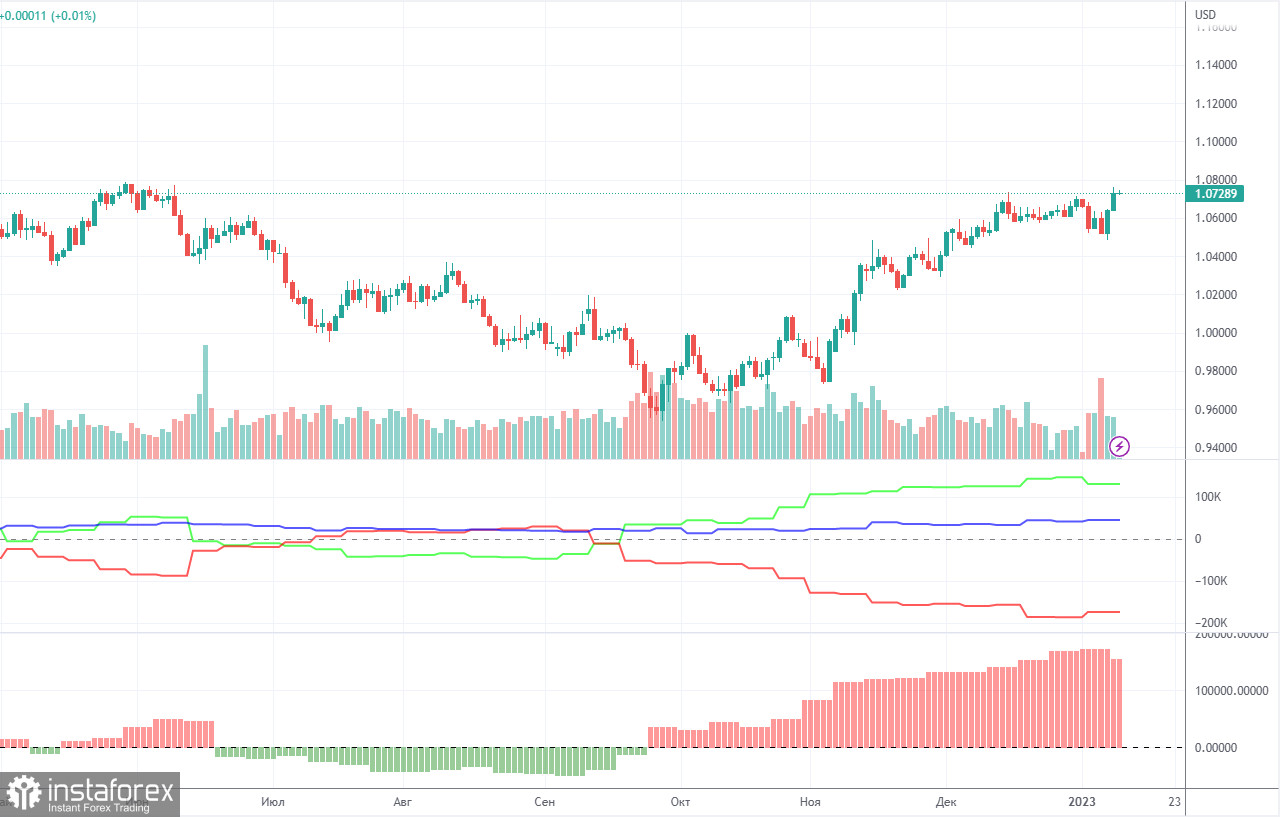
COT report
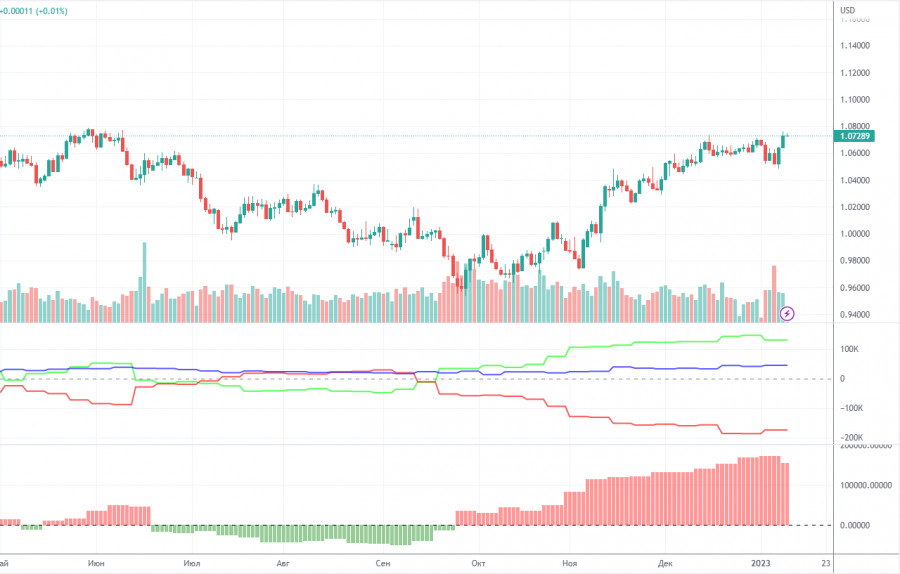
The COT reports for the euro in the last few months have been fully consistent with what is happening in the market. You can clearly see on the chart that the net position of big players (the second indicator) has been growing since early September. Around the same time, the euro started to grow. At this time, the net position of the non-commercial traders has been bullish and strengthens almost every week, but it is a rather high value that allows us to assume that the upward movement will end soon. Notably, the green and red lines of the first indicator have moved far apart from each other, which often means the end of the trend. During the given period, the number of long positions held by non-commercial traders increased by 16,000, whereas the number of short positions rose by 11,000. Thus, the net positions increased by 5,000. The number of long positions is 135,000 higher than the number of short positions opened by non-commercial traders. So the question now is how long will the big players increase their longs? Moreover, from a technical perspective, a bearish correction should have started a long time ago. In my opinion, this process can not continue for another 2 or 3 months. Even the net position indicator shows that we need to "unload" a bit, that is, to correct. The overall number of short orders exceeds the number of long orders by 48,000 (702,000 vs. 655,000).
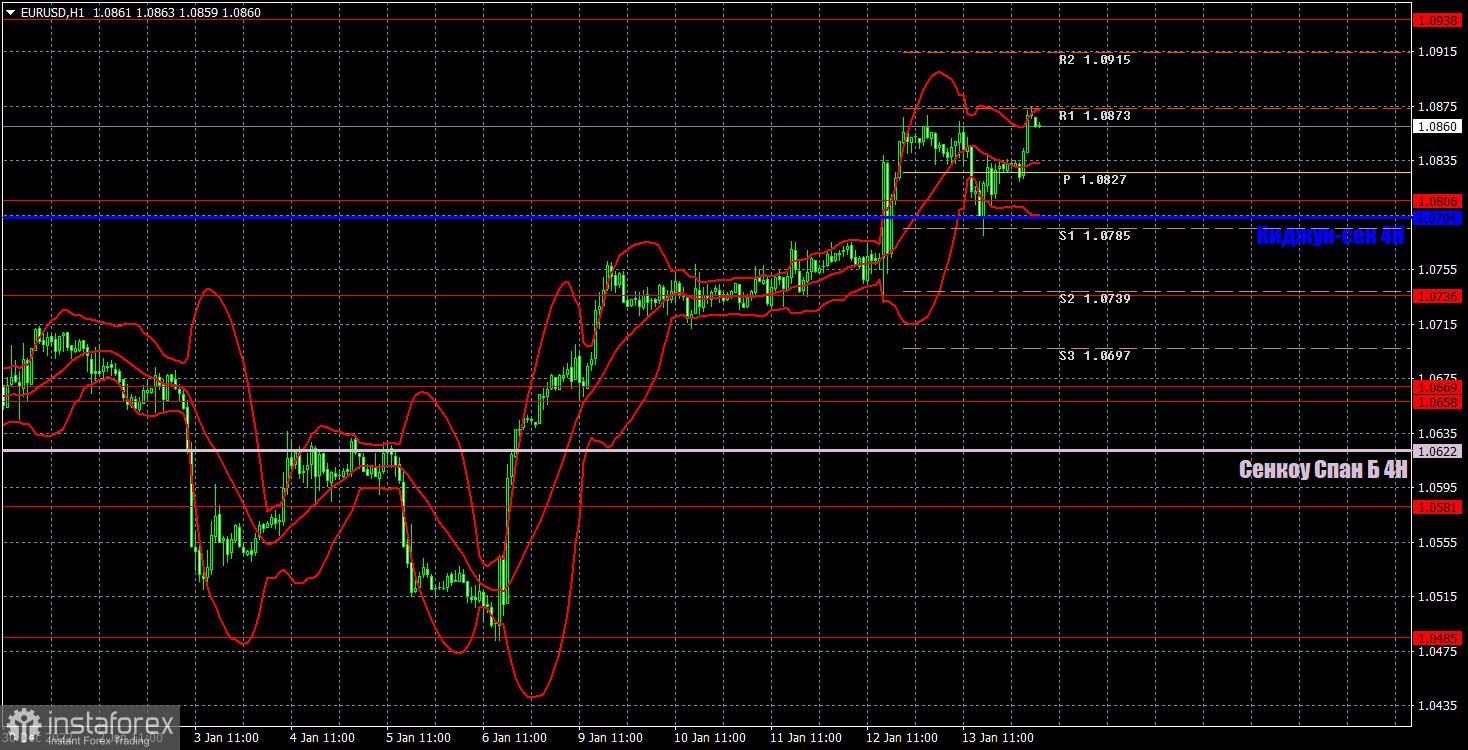
H1 chart of EUR/USD
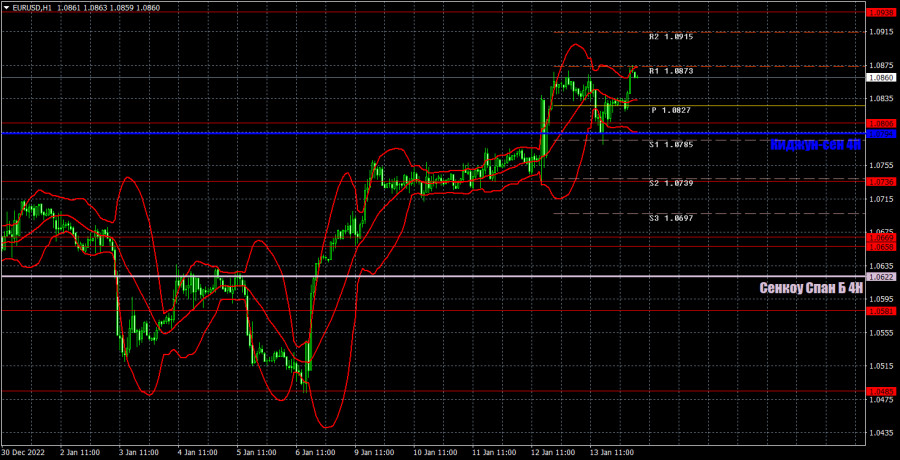
On the one-hour chart, EUR/USD continues the upward movement, which started last Friday. The rebound from the Kijun-Sen line has preserved the uptrend, so the euro can continue to rise, even despite the lack of fundamental and macroeconomic background on Monday. The market only sees the euro. On Monday, the pair may trade at the following levels: 1.0658-1.0669, 1.0736, 1.0806, 1.0938, 1.1036, 1.1137 as well as the Senkou Span B (1.0622) and Kijun-Sen (1.0794). Lines of the Ichimoku indicator may move during the day, which should be taken into account when determining trading signals. There are also support and resistance levels, but signals are not formed near these levels. Bounces and breakouts of the extreme levels and lines could act as signals. Don't forget about stop-loss orders, if the price covers 15 pips in the right direction. This will prevent you from losses in case of a false signal. There are no important events or reports scheduled for January 16 in the US and EU. So there will be nothing for traders to react to, but the euro can continue to rise in the current circumstances.
What we see on the trading charts:
Price levels of support and resistance are thick red lines, near which the movement may end. They do not provide trading signals.
The Kijun-sen and Senkou Span B lines are the lines of the Ichimoku indicator, moved to the one-hour chart from the 4-hour one. They are strong lines.
Extreme levels are thin red lines from which the price bounced earlier. They provide trading signals.
Yellow lines are trend lines, trend channels, and any other technical patterns.
Indicator 1 on the COT charts reflects the net position size of each category of traders.
Indicator 2 on the COT charts reflects the net position size for the non-commercial group.