Yesterday, the pair formed several entry signals. Let's have a look at the 5-minute chart and see what happened there. In my morning review, I mentioned the level of 1.2186 as a possible entry point. The pound made a rapid move toward this level but still failed to test it. However, after the release of strong data on the UK labor market, the price broke through 1.2186 so I still couldn't get any entry signals. In the second half of the day, the pair settled above 1.2198 and retested it which generated a good entry point into long positions. As a result, the pound jumped by 60 pips following the publication of inflation data in the US. In the middle of the North American session, the pair dropped to 1.2139. A false breakout at this level allowed me to open buy positions and get another 60 pips in profit.
For long positions on GBP/USD:
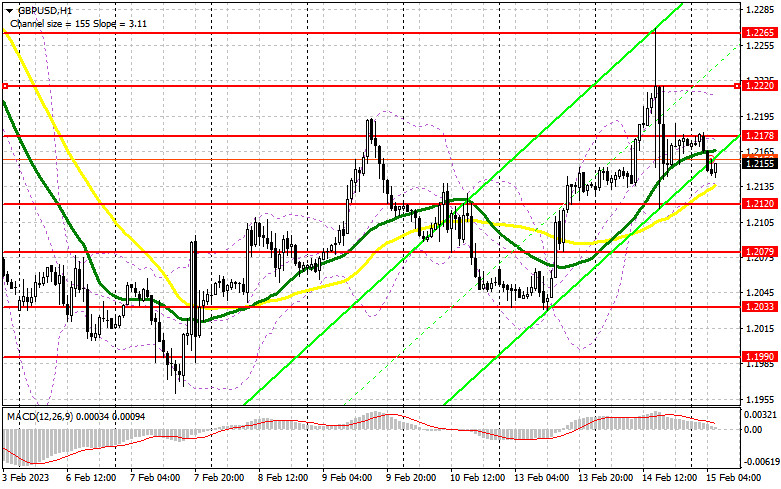
Today will be quite an eventful day that will start with the UK macroeconomic data. Markets will take notice of the consumer price index as well as the producer price index. Slowing inflation will weigh on the pound while its acceleration will initiate a new upward movement in the pair. If inflation remains heated, markets will expect the BoE to keep rates high for longer than was previously planned. The UK house price index will be of little interest to traders. If the pair declines, you should watch for buying opportunities after a false breakout at 1.2120, the level of support that was formed yesterday and below which the moving averages support the bulls. This will allow you to make sure that large market players have entered the market. If so, the pound may head for the 1.2178 area where an intensive trading activity may start. I will bet on the further uptrend in GBP/USD and its rise to the high of 1.2220 only if the price settles above 1.2178 and retests it from top to bottom amid accelerated inflation in the UK. A break above this range will pave the way to the next upward target at 1.2265 where I'm planning to lock in profits. If bulls fail to open positions at 1.2120, GBP/USD will come under more pressure. In this case, I would advise you to go long only near the next support at 1.2079 and only in case of a false breakout. I will buy GBP/USD right after a rebound from the level of 1.2033, keeping in mind an intraday correction of 30-35 pips.
For short positions on GBP/USD:
Bears asserted themselves yesterday at the level of 1.2265 and are not going to leave the market. The UK CPI data may cause more volatility in the pair. The market is also likely to focus on retail sales data in the US. Today, the main goal for bears is to defend the nearest resistance area at 1.2178. A rise and a false breakout of this level may generate a sell signal and send the pair down to 1.2120. Its breakout and a retest will cancel the plans of the bulls to recover quickly after last week's sell-off. If so, bears will increase their presence in the market and may form a sell signal with the target at 1.2079. The level of 1.2033 will serve as the lowest target and its retest will indicate the formation of a new downtrend. This is where I'm going to take profit. In case GBP/USD rises and bears are idle at 1.2178, bulls will take full control of the market. Bears will retreat until the US retail sales data is out, hoping to see a stronger reading. If so, only a false breakout at the next resistance of 1.2220 will form an entry point into short positions. If nothing happens there as well, I will sell GBP/USD from the high of 1.2265, considering a possible pullback of 30-35 pips within the day.
COT report:
Due to a technical failure of the CFTC that has been going on for more than two weeks, new COT reports continue to be delayed. The most recent data was published on January 24.
The Commitments of Traders report for January 24 recorded a sharp drop in both long and short positions. However, this decline was within an acceptable range, given the situation the UK government is currently dealing with. The UK authorities are facing strikes and demand for higher wages while trying to bring inflation lower. According to the latest COT report, short positions of the non-commercial group of traders decreased by 7,476 to 58,690 while long positions dropped by 6,713 to 34,756. As a result, the negative value of the non-commercial net position declined to -23,934 from -24,697 recorded a week ago. Such moderate changes do not change the market balance. So, we should continue monitoring the economic situation in the UK and the decisions of the BoE. The weekly closing price went up to 1.2350 from 1.2290.
Indicator signals:
Moving Averages
Trading near the 30- and 50-day moving averages indicates market uncertainty.
Please note that the time period and levels of the moving averages are analyzed only for the H1 chart, which differs from the general definition of the classic daily moving averages on the D1 chart.
Bollinger Bands
If the pair advances, the upper band of the indicator at 1.2220 will serve as resistance. In case of a decline, the lower band of the indicator at 1.02140 will act as support.
Description of indicators:
• A moving average of a 50-day period determines the current trend by smoothing volatility and noise; marked in yellow on the chart;
• A moving average of a 30-day period determines the current trend by smoothing volatility and noise; marked in green on the chart;
• MACD Indicator (Moving Average Convergence/Divergence) Fast EMA with a 12-day period; Slow EMA with a 26-day period. SMA with a 9-day period;
• Bollinger Bands: 20-day period;
• Non-commercial traders are speculators such as individual traders, hedge funds, and large institutions who use the futures market for speculative purposes and meet certain requirements;
• Long non-commercial positions represent the total number of long positions opened by non-commercial traders;
• Short non-commercial positions represent the total number of short positions opened by non-commercial traders;
• The non-commercial net position is the difference between short and long positions of non-commercial traders.


