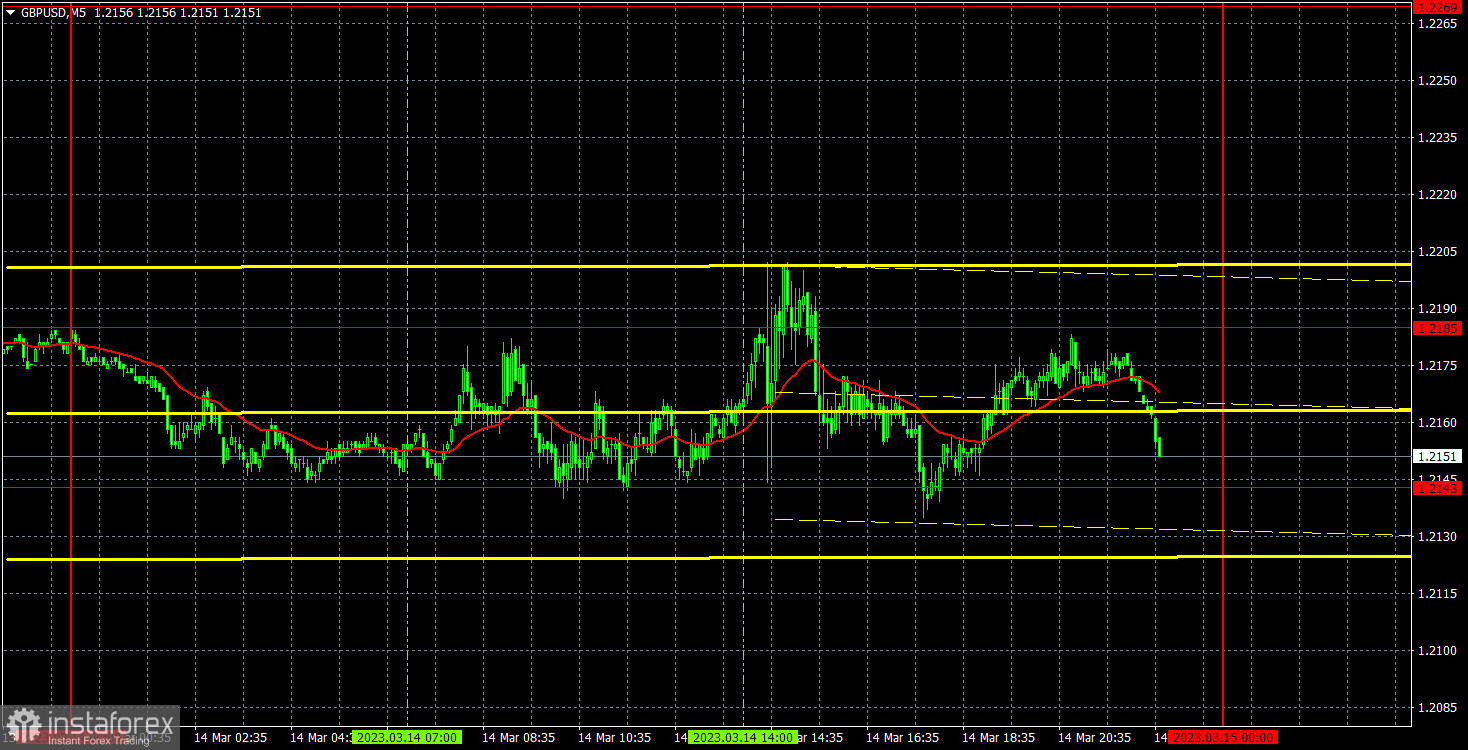
5M chart of GBP/USD
On Wednesday, GBP/USD also fell significantly, but its decline was much weaker compared to the EUR/USD pair. Credit Suisse's problems are more related to Europe, not to Britain. Moreover, the European Central Bank meeting will be held today, but not the Bank of England. Therefore, the fact that the market is in an excited state on the euro is not surprising. Pound traders could only pay attention to the U.S. retail sales and producer price reports, each of which could not support the U.S. currency in any way. Perhaps, some reaction to these reports followed, but it was insignificant. We are still waiting for the pound to fall harder, but on the 24-hour chart, the pair is still moving in the horizontal channel. It has been there for several months already. It has to be taken into account in the first place.
There were few trading signals on Wednesday and it all started with a false buy signal near 1.2143. The price didn't even pass 20 pips in the right direction, so the short position closed with a loss of about 25 pips. On the other hand, the next sell signal near the same level resulted in a profit of about 100 pips. The price went down to the critical line, but then it bounced back. Traders could even open another long position on a rebound from the Kijun-Sen, which was also profitable, if the current size of the profit was not enough. In general, the pound was moving quite well and was volatile.
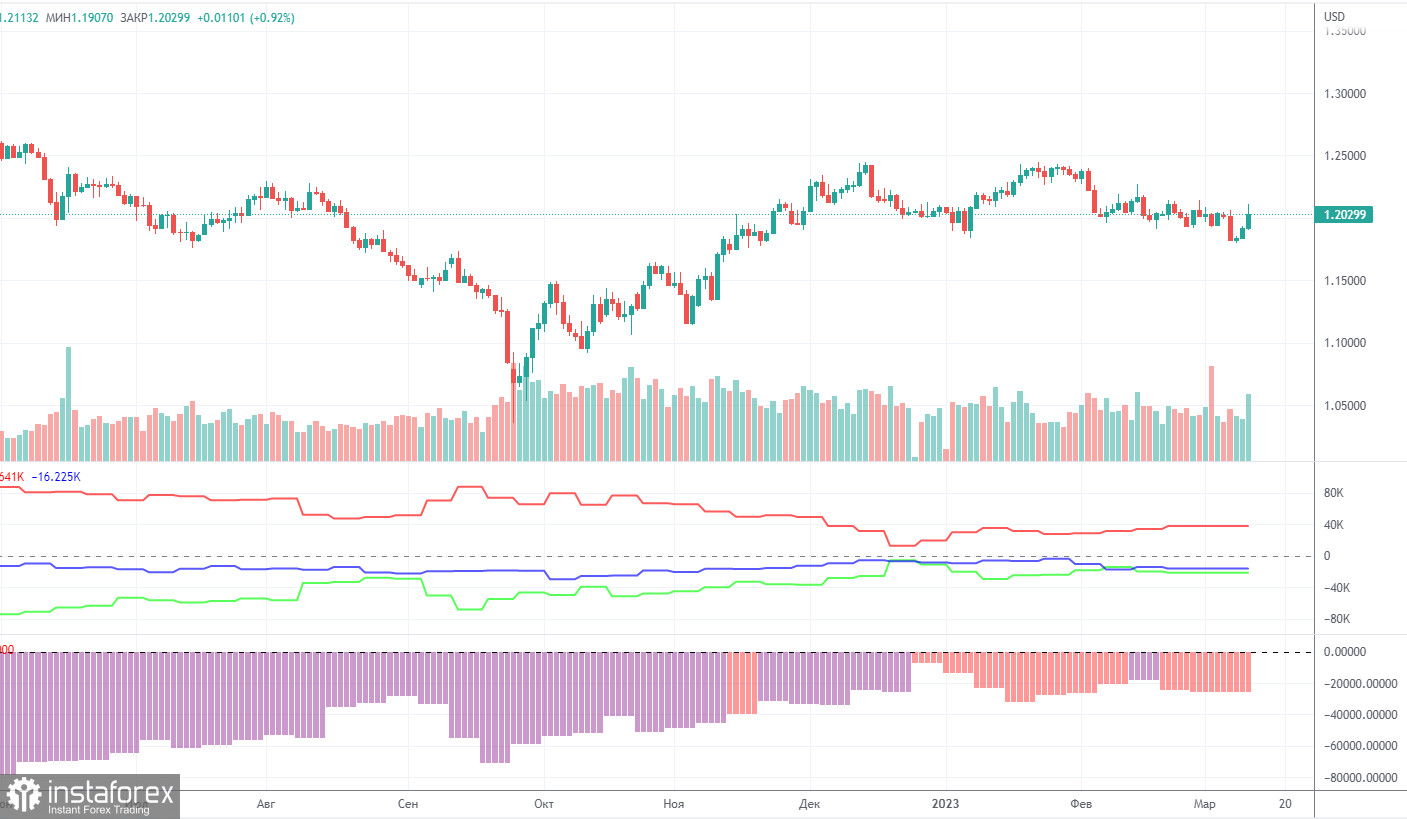
COT report:
The latest COT report on GBP/USD dates back to February 21. Naturally, these reports are of little use now, but it's still better than nothing at all. According to the latest data, non-commercial traders opened 3,300 long positions and 4,900 short ones. The net position fell by 1,600. The net non-commercial position has been bullish in recent months although sentiment remains bearish. The pound has been on the rise against the greenback for some unknown reason. We should not rule out the possibility of a strong decline in price in the near term. Technically, it has already started to decline although it seems to be a flat trend. In fact, the movement of GBP/USD is now akin to that of EUR/USD. At the same time, the net position on EUR/USD is positive, signaling the upcoming end of the bullish momentum. Meanwhile, the net position on GBP/USD is negative. Non-commercial traders now hold 67,000 sell positions and 46,000 long positions. There is still a gap. We are still skeptical that the pair will be bullish in the long term and expect a steep drop.
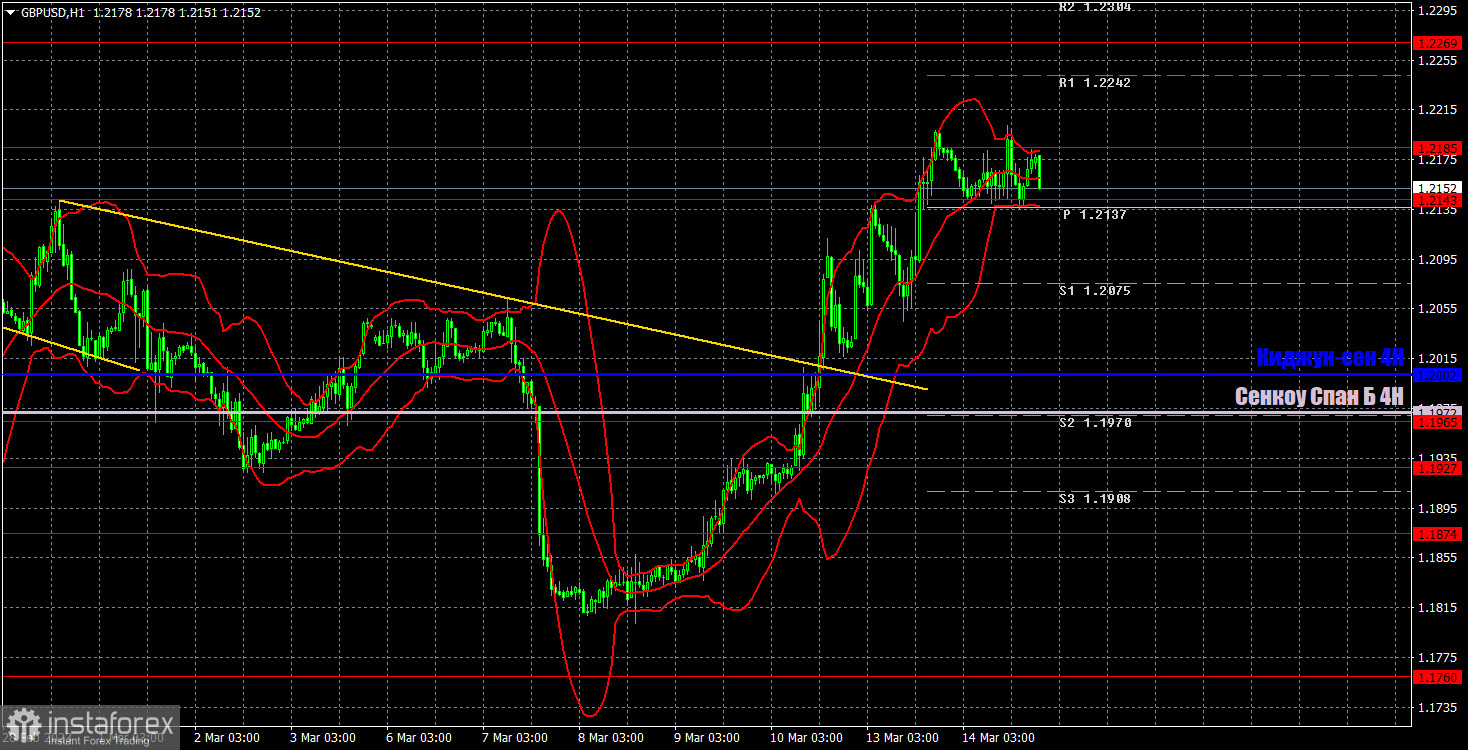
1H chart of GBP/USD
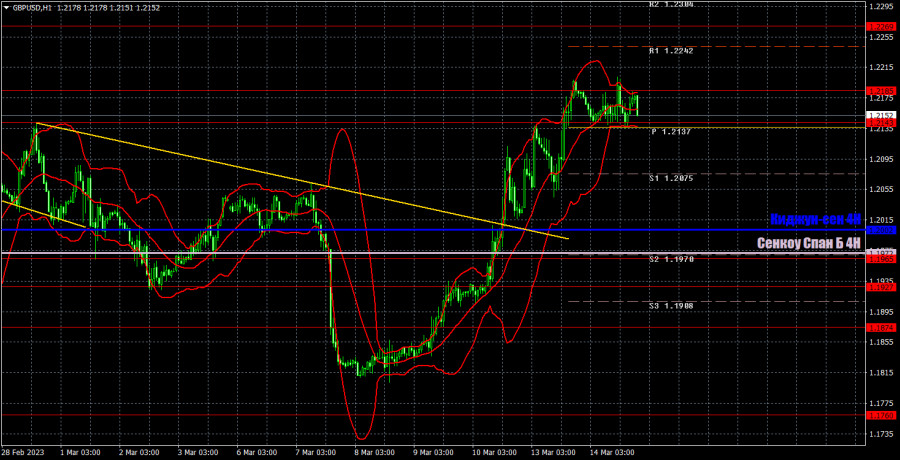
On the one-hour chart, GBP/USD has not yet fallen below the Ichimoku indicator lines, so there is still hope that it can rise further. At least within the framework of the horizontal channel on the 24-hour chart, which, I should remind you, is 600 points wide. Therefore, the pound still has a potential to rise, but only technically. From a fundamental point of view, I expect the pound to fall for a long time. On March 16, it is recommended to trade at the key level of 1.1760, 1.1874, 1.1927, 1.1965, 1.2143, 1.2185, 1.2269, 1.2342, 1.2429. The Senkou Span B (1.1972) and Kijun Sen (1.2049) lines can also generate signals. Rebounds and breakouts from these lines can also serve as trading signals. It is better to set the Stop Loss at breakeven as soon as the price moves by 20 pips in the right direction. The lines of the Ichimoku indicator can change their position throughout the day which is worth keeping in mind when looking for trading signals. On the chart, you can also see support and resistance levels where you can take profit. On Thursday, there are no important events and reports planned for Great Britain. In the US, it's just secondary reports, which are unlikely to trigger a strong market reaction. So, we do not expect any weak moves or flat, the market is still in an excited condition now. If the price overcomes the Senkou Span B line we might expect another 100-150 pips drop.
Indicators on charts:
Resistance/support - thick red lines, near which the trend may stop. They do not make trading signals.
Kijun-sen and Senkou Span B are the Ichimoku indicator lines moved to the hourly timeframe from the 4-hour timeframe. They are also strong lines.
Extreme levels are thin red lines, from which the price used to bounce earlier. They can produce trading signals.
Yellow lines are trend lines, trend channels, and any other technical patterns.
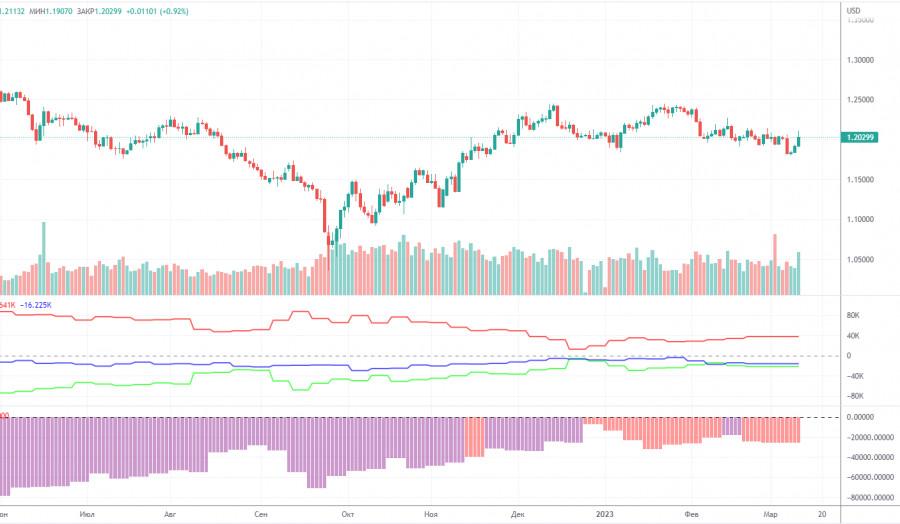
Indicator 1 on the COT chart is the size of the net position of each trader category.
Indicator 2 on the COT chart is the size of the net position for the Non-commercial group of traders.