Analyzing Tuesday's trades:
GBP/USD on 30M chart
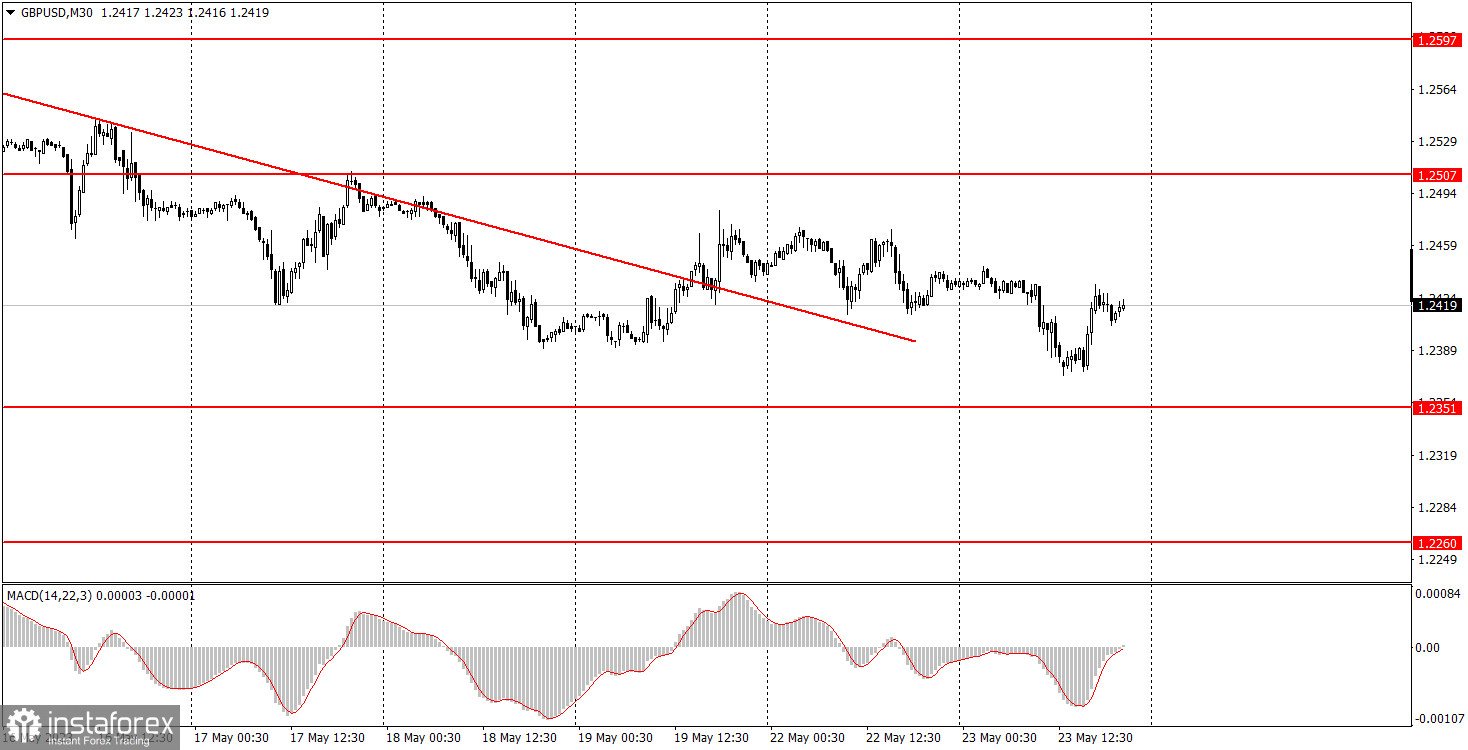
The GBP/USD pair showed similar movements to the EUR/USD pair on Tuesday. Initially, GBP/USD fell, then rose, and volatility was also relatively low. The pair breached the descending trendline a couple of days ago, but I already warned you that the downtrend could remain intact. We have yet to see any significant bullish correction. From our perspective, the pound has not fallen significantly enough over the past two weeks, so I still expect a more pronounced decline. The only possibility is that it may take longer due to the noticeable decline in market activity in recent weeks and months.
Regarding macro data, the PMIs in the UK and the US were noteworthy on Tuesday. In the UK, the manufacturing sector showed a negative trend, while the services sector remained strong. Additionally, Bank of England Governor Andrew Bailey delivered a speech in Parliament, where he acknowledged that interest rates could rise for a longer and stronger period if inflation does not decrease rapidly and significantly. This information could have supported the pound, but the British currency remains significantly overbought. Most likely, it simply prevented the pound from falling further.
GBP/USD on 5M chart
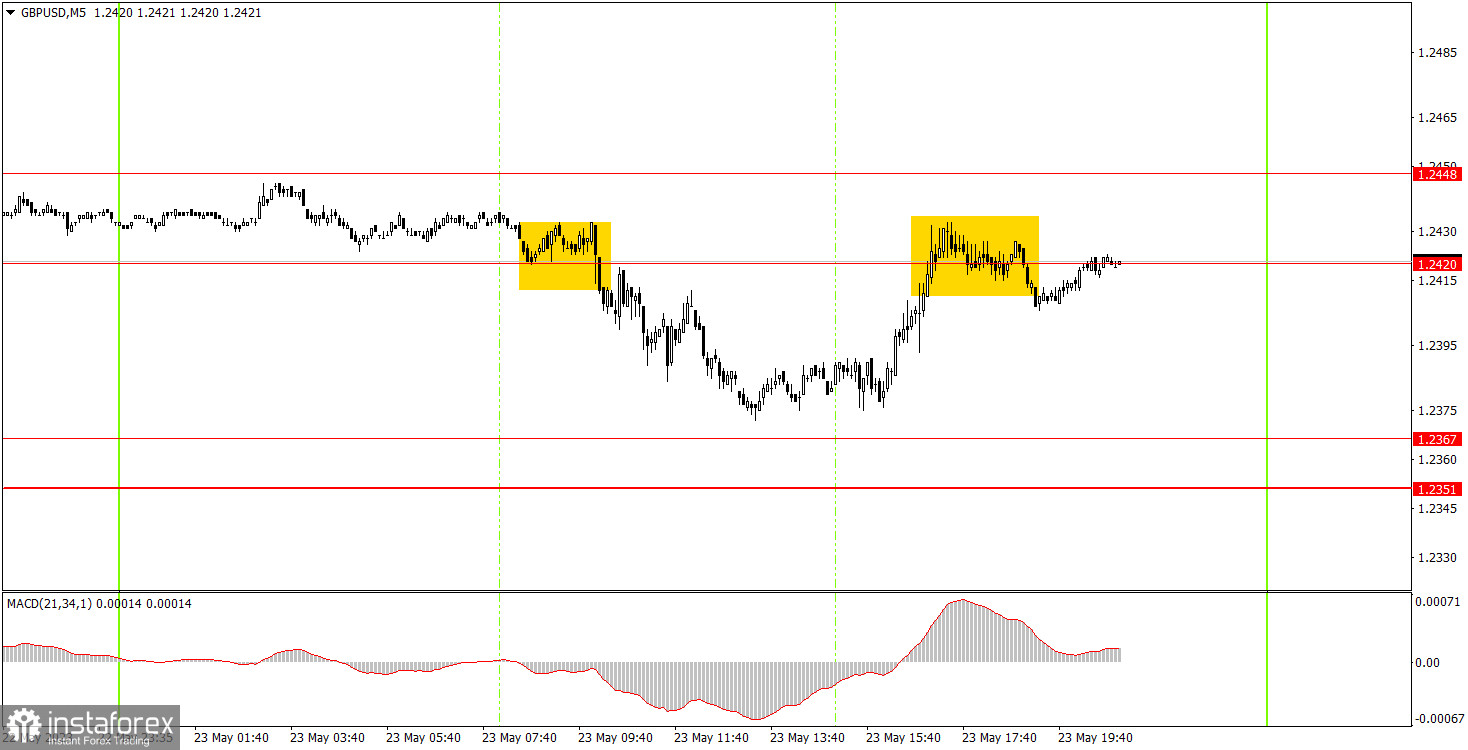
There were only two trading signals on the 5-minute chart on Tuesday. Initially, the pair settled below the 1.2420-1.2448 range but failed to reach the target level of 1.2367, falling short by only 5 pips, and then returned to its initial positions. Therefore, traders were unable to profit from this trade. It rebounded from the indicated range, but it was so imprecise and weak that this signal should not have been executed. Thus, beginners likely did not generate profits today, but they also did not incur losses. Take note that it is very challenging to expect profits when movements are relatively weak.
Trading tips on Wednesday:
On the 30-minute chart, the GBP/USD pair tried to break the downtrend. It breached the trendline on Friday. However, it has not entered a bullish correction. I still believe that the decline of the British currency is likely to continue in any case. On the 5M chart, the key levels can be found at 1.2171-1.2179, 1.2245-1.2260, 1.2351-1.2367, 1.2420-1.2448, 1.2507-1.2520, 1.2597-1.2616, 1.2659, 1.2697. When the price moves in the correct direction by 20 pips after entering a trade, a stop loss order can be placed to breakeven. In the UK, Bailey is scheduled to deliver another speech, and an inflation report will also be published. These two events can trigger a strong market reaction and high volatility. However, we do not expect any "loud" statements from Bailey. He has already spoken on Tuesday, and the market reaction was more than modest.
Basic rules of the trading system:
1) The strength of the signal depends on the time period during which the signal was formed (a rebound or a break). The shorter this period, the stronger the signal.
2) If two or more trades were opened at some level following false signals, i.e. those signals that did not lead the price to Take Profit level or the nearest target levels, then any consequent signals near this level should be ignored.
3) During the flat trend, any currency pair may form a lot of false signals or do not produce any signals at all. In any case, the flat trend is not the best condition for trading.
4) Trades are opened in the time period between the beginning of the European session and until the middle of the American one when all deals should be closed manually.
5) We can pay attention to the MACD signals in the 30M time frame only if there is good volatility and a definite trend confirmed by a trend line or a trend channel.
6) If two key levels are too close to each other (about 5-15 pips), then this is a support or resistance area.
How to read charts:
Support and Resistance price levels can serve as targets when buying or selling. You can place Take Profit levels near them.
Red lines are channels or trend lines that display the current trend and show which direction is better to trade.
MACD indicator (14,22,3) is a histogram and a signal line showing when it is better to enter the market when they cross. This indicator is better to be used in combination with trend channels or trend lines.
Important speeches and reports that are always reflected in the economic calendars can greatly influence the movement of a currency pair. Therefore, during such events, it is recommended to trade as carefully as possible or exit the market in order to avoid a sharp price reversal against the previous movement.
Beginners should remember that every trade cannot be profitable. The development of a reliable strategy and money management are the key to success in trading over a long period of time.