Analysis of EUR/USD 5M
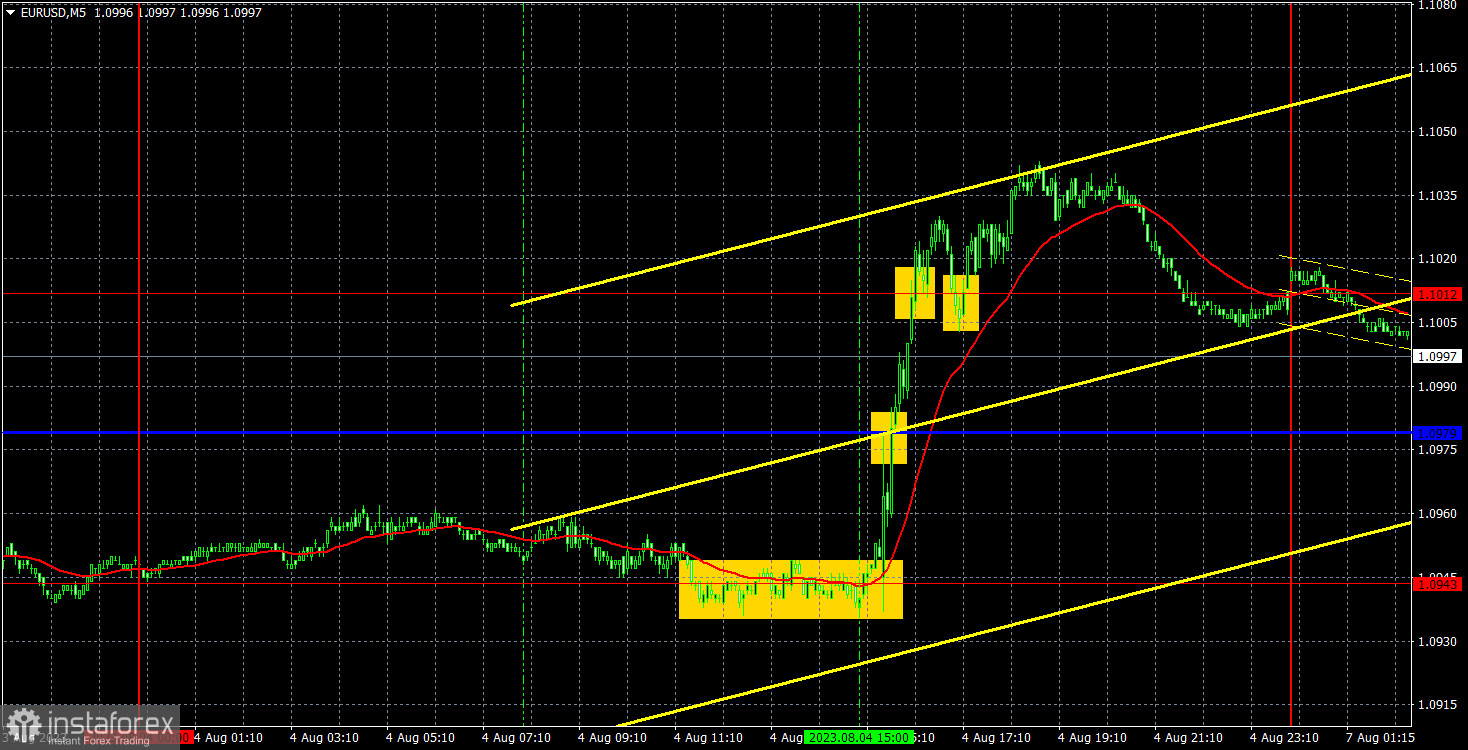
The EUR/USD pair traded almost unchanged during the first half of Friday. The pair was relatively muted alongside no significant economic data during the European trading session, which explains the flat movement. However, in the second half of the day, the most important reports of the previous week were published, leading to a sharp movement of 105 pips, which is quite reasonable. The nonfarm payroll came in lower than forecast, but the unemployment rate decreased to 3.5%, which the market completely ignored. We can see that the US economic reports were not bad enough to cause the dollar to drop by 1 cent within a few hours. In general, we expect the downward movement to resume.
Speaking of trading signals, they were quite good on Friday. The pair bounced off the level of 1.0943, and since we expected the dollar to fall after the US reports, traders could enter a long position. A strong rally began, and the pair surpassed the critical line and the level of 1.1012. It stayed above the level of 1.1012 until the end of the day. Therefore, traders could close longs, and the least amount of profit on them was 70 pips. In general, it was quite a decent day.
COT report:
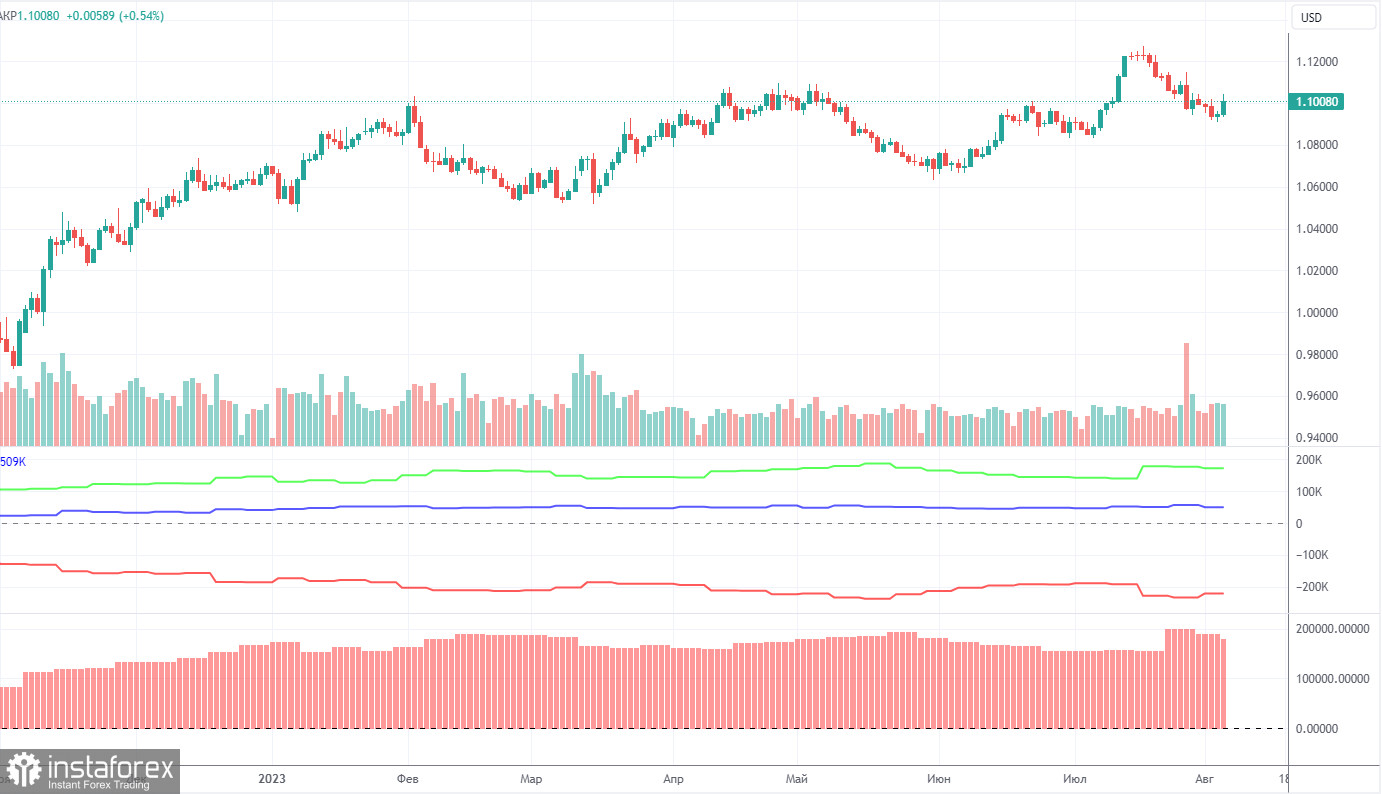
On Friday, a new COT report for August 1 was released. In the last 10 months, COT reports fully corresponded to what is happening in the market. The chart above clearly shows that the net position of major traders (the second indicator) began to grow in September 2022 and at about the same time the euro started climbing too. In the last 5-6 months, the net position has not risen but the euro remains at very high levels. At the moment, the net position of non-commercial traders is bullish and remains strong. The euro keeps climbing against the US dollar.
I have already mentioned the fact that a fairly high value of the net position signals the end of an uptrend. This is also confirmed by the first indicator where the red and green lines are very far from each other. Usually, it precedes the end of the trend. During the last reporting week, the number of long positions of the non-commercial group of traders fell by 10,500 and the number of short ones by 5,400. The net position decreased by 5,100 contracts. The number of long positions is higher than the number of short ones of non-commercial traders by 172,000. This is a very large gap as the difference is almost threefold. Even without COT reports, it is obvious that the euro should decline but speculators are still in no hurry to sell.
Analysis of EUR/USD 1H
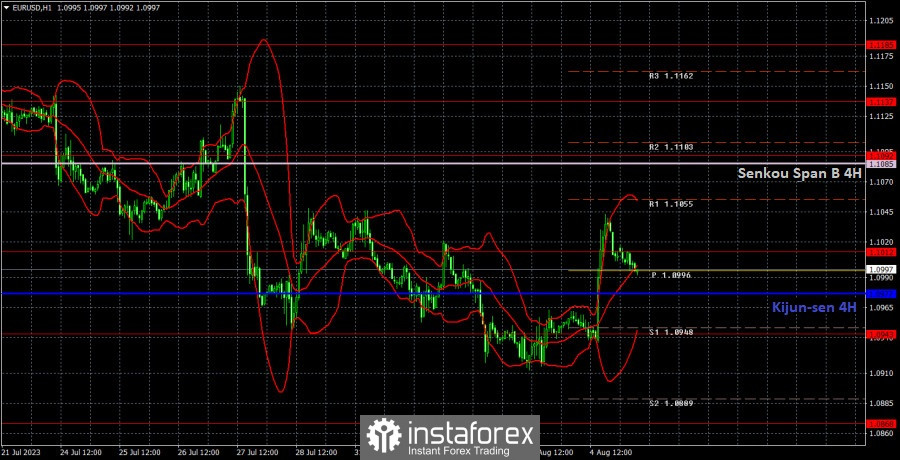
On the 1H chart, the euro/dollar pair continues to move lower. We believe that the euro should fall in the medium term, but corrections should occur from time to time. There will be few important events this week, but the inflation report may be enough to fuel the dollar to grow stronger. However, this report may show an increase in inflation, not a decrease, so the corrective phase may continue.
On August 7, traders should pay attention to the following key levels: 1.0762, 1.0806, 1.0868, 1.0943, 1.1012, 1.1092, 1.1137, 1.1185, 1.1274, as well as the Senkou Span B line (1.1085) and the Kijun-sen line (1.0977). The lines of the Ichimoku indicator can move during the day, which should be taken into account when determining trading signals. There are support and resistance levels that can be used to lock in profits. Traders look for signals at rebounds and breakouts. It is recommended to set the Stop Loss orders at the breakeven level when the price moves in the right direction by 15 pips. This will protect against possible losses if the signal turns out to be false.
Today, there are no important events or reports lined up in the EU and the US. Most likely, we should brace ourselves for another low-volatility day with no trends.
Description of the chart:
Support and resistance levels are thick red lines near which the trend may end. They do not provide trading signals;
The Kijun-sen and Senkou Span B lines are the lines of the Ichimoku indicator, plotted to the 1H timeframe from the 4H one. They provide trading signals;
Extreme levels are thin red lines from which the price bounced earlier. They provide trading signals;
Yellow lines are trend lines, trend channels, and any other technical patterns;
Indicator 1 on the COT charts is the net position size for each category of traders;
Indicator 2 on the COT charts is the net position size for the Non-commercial group.