EUR/USD traded lower on Friday within a trading range between 1.0925 and 1.1047. At the moment, the price has approached the lower border of this channel for the third time, from which the instrument may rebound again. If a bounce occurs, then the price will begin a new upward movement. For such a movement, the fundamental and macroeconomic background does not matter at all. Therefore, the level of 1.0925 is now the key to some extent, at least on Monday.
On Friday, several minor reports were published in the US, which helped the US dollar to strengthen. In fact, only one report was meaningful, but even that report cannot be considered super-important. Producer price index rose in July and grew slightly stronger than expected by the market. Besides, consumer prices in the US accelerated in July on month. Thus, the market now sees stronger likelihood of a new round of tightening monetary policy before the year end. In turn, the US dollar advanced on these expectations.
We still believe that EUR/USD is likely to fall on the back of the greenback's strength regardless of the fundamental and macroeconomic background. The ECB has hinted indirectly several times that it is ready to pause its tightening cycle this autumn, so there is simply no reason for the euro to rise. If we take a long-term plan, then EUR/USD has not shown any considerable correction over the past 11 months of growth. Thus, in any case, we foresee the euro's weakness.
Traders to learn data of secondary importance
There will be few super-important events this week, especially in the European Union. The economic calendar on Monday is completely empty. The index of economic expectations from the ZEW Institute for Germany and the EU will be released on Tuesday. The data on GDP and industrial production will be available on Wednesday. On Friday, traders will get to know the consumer price index. It would seem that a lot of interesting reports are ahead this week. The question is whether all of them are really worthy of note.
The first thing that catches your eye is the GDP report. However, this will be the second estimate of the indicator, which is objectively the least interesting of all. The market has already priced in the fact that the EU economy may grow by 0.3% in the second quarter. Since the assessment is not final, its sharp changes are not expected. The second thing that attracts attention is the inflation report. However, this will also be the second estimate, which is unlikely to differ from the first one. The consumer price index may slow down to 5.3% y/y in July, while core inflation may remain at 5.5% y/y. It is too early to make the conclusion that the ECB is going to complete the tightening cycle. Nevertheless, inflation in the EU is ebbing away, which means that with each new month there are fewer and fewer reasons to tighten monetary policy. So, the shared currency has less and less reason to assert its strength.
All other reports are of secondary importance and are unlikely to provoke at least some market reaction. Therefore, if the level of 1.0925 is overcome, the currency pair will continue to decline with a high degree of probability. A bounce will leave the instrument in the trading range. It turns out that it is the technical picture that comes first in terms of importance this week.
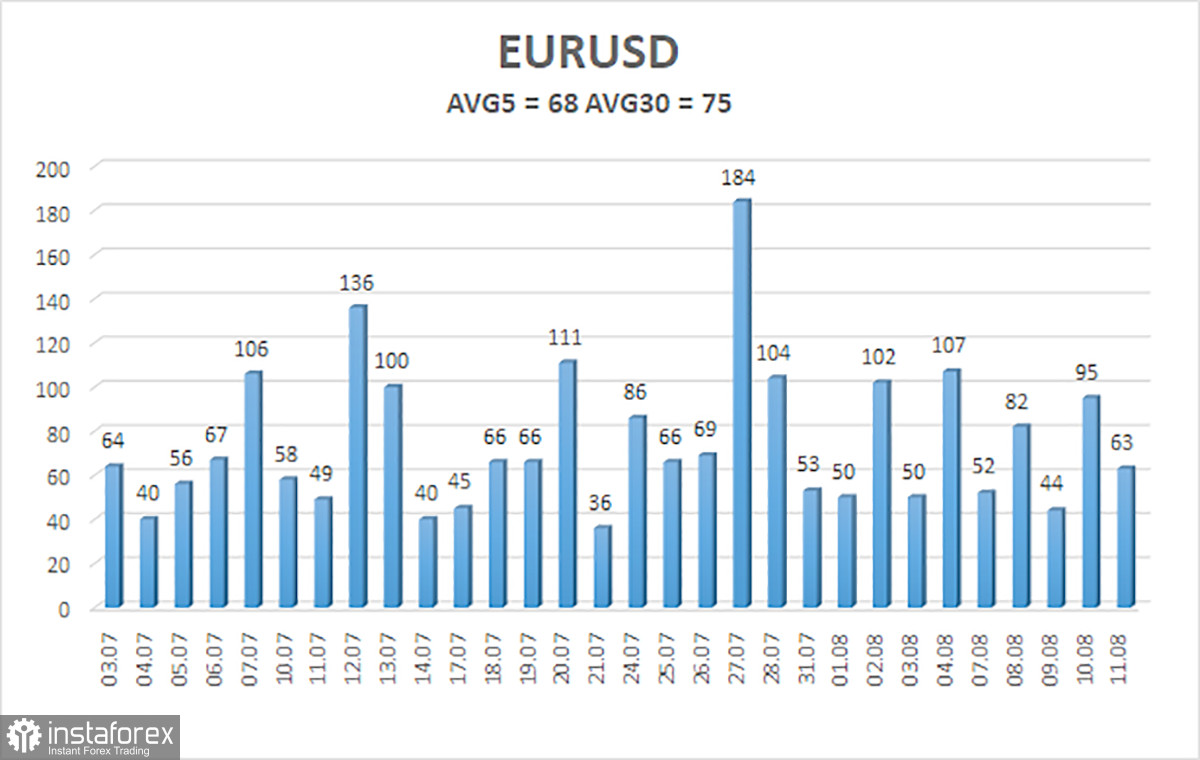
As of August 14, the average volatility of EUR/USD for the last 5 trading days is 68 points and is defined as average. Thus, we expect the pair to oscillate between 1.0870 and 1.1006 on Monday. The upward reversal of the Heiken Ashi indicator will indicate a new upward movement within the flat market.
Nearest support levels
S1 – 1.0925
S2 – 1.0864
S3 – 1.0803
Nearest resistance levels
R1 – 1.0986
R2 – 1.1047
R3 – 1.1169
Trading tips on EUR/USD
EUR/USD began an upward correction which smoothly turned into a sideways move. Now it makes sense to plan long positions with targets at 1.0986 and 1.1006 in case the price rebounds from 1.0925. Alternatively, short positions will be reasonable in case the price settles below 1.0925 with targets at 1.0870 and 1.0864.
What's on charts
Linear regression channels help to determine the current trend. If both channels are directed in the same direction, it means that a strong trend is unfolding.
A moving average line (settings 20.0, smoothed) determines the short-term trend and the direction in which you should now trade.
Murray levels are target levels for movements and corrections.
Volatility levels (red lines) are a likely price channel in which the instrument will spend the next day, based on current volatility indicators.
The CCI indicator means its entry into the oversold area (below -250) or overbought area (above +250). It indicates that a trend is going to reverse in the opposite direction.