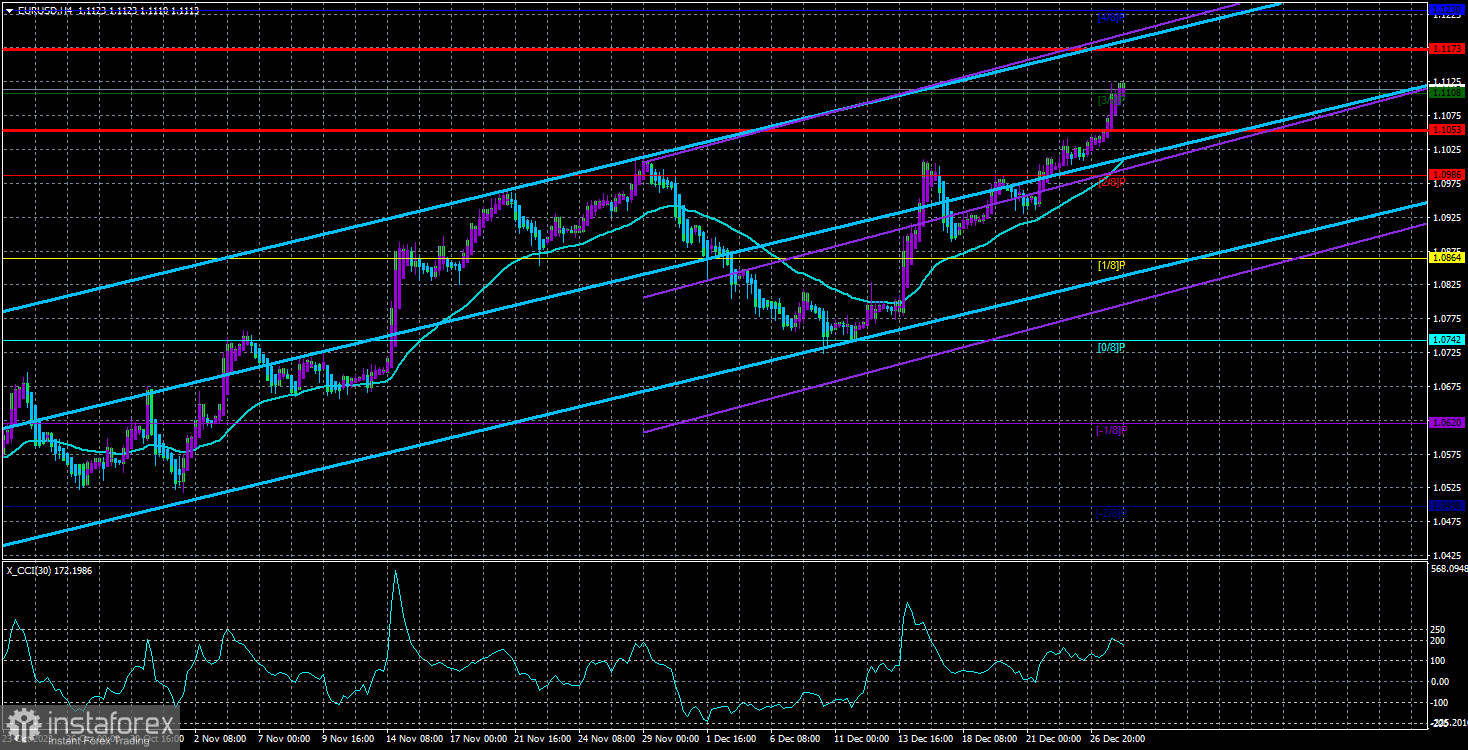
The currency pair EUR/USD continued its upward movement even on Tuesday. Take a closer look at the illustration above! The pair is in almost non-retraceable growth, although there are still no reasons. There may be reasons for the dollar's decline in November. There may have been reasons even in December when the ECB, BOJ, and Fed meetings occurred. But hardly anyone will deny that during a week when no macroeconomic reports or fundamental events are planned, there are no reasons for the market to buy or sell.
There are more reasons for buying the dollar now than selling it because technical corrections don't require reasons and bases. The pair stays in a trend for a while, and traders start taking profits, which triggers a correction. But now, traders are not taking profits; they continue to build long positions. Thus, we get the purest "Bitcoin-style" movement. The European currency is strengthening simply because it is being bought. That's the whole logic.
When the fundamental and macroeconomic backdrop were strong, the dollar fell. When the macroeconomic and fundamental backdrop is absent, the dollar falls. So what's the difference, whether it's there or not? Why pay attention to it if it does not impact the pair's movement? The market increases long positions every day. Occasionally, there are corrections, but the main strong movement should also have some reasons behind it. But there are none.
We can only advise traders to trade with the trend and align with the current technical picture. By the way, we want to add another important fact. Despite the holiday status of the current week, the EUR/USD pair is not standing still. The market is "thin," so even a few new deals are enough to move the exchange rate. Yes, the rise is not strong, but stable and non-retraceable.
Certainly, numerous analysts may discuss the increase in risk sentiment, the ECB's relatively more "hawkish" stance in contrast to the Federal Reserve, the lackluster US economic data over the past two months, and Jerome Powell's recent "dovish" remarks. However, all these reasons are not reasons but ways to explain the current movement somehow. With the same success, the dollar may start rising tomorrow, and "experts" will write about the growth of risk-off sentiments or remember that the ECB will also lower the key rate next year.
We should acknowledge the obvious. It's not always possible to predict the movement of a particular currency. The market has many participants, and predicting its overall or middle sentiment takes a lot of work. Forecasting the further movement of the pair based on this information is even more challenging. That's why we find ourselves in a situation where most factors favor strengthening the US currency, but the currency falls almost every day. Even technical indicators that indicate the euro's overbought condition are not considered. Thus, we can only consider long positions until the price consolidates below the moving average. There are currently no signals for selling.
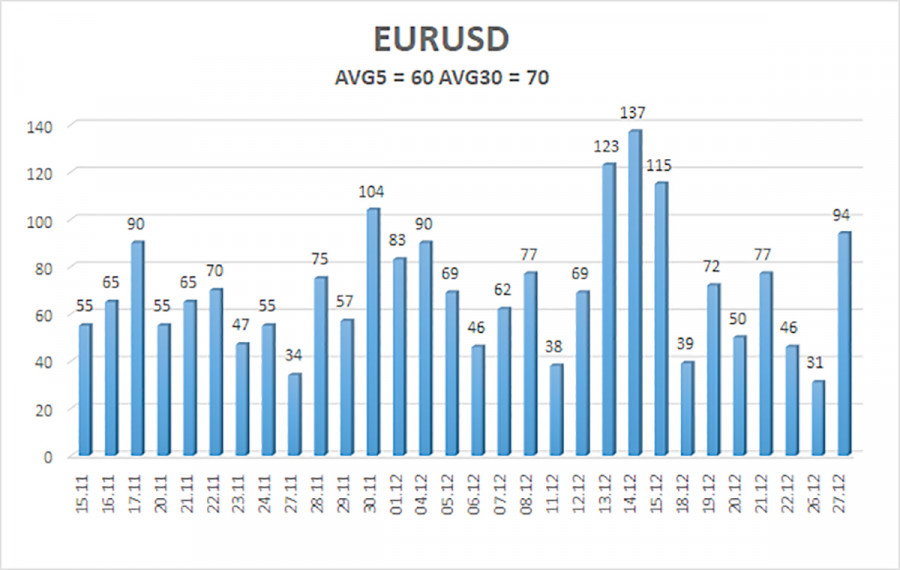
The average volatility of the EUR/USD currency pair over the last five trading days as of December 28 is 60 points and is characterized as "average." Therefore, we expect the pair to move between the levels of 1.1053 and 1.1173 on Thursday. A downward reversal of the Heiken Ashi indicator will indicate a new phase of corrective movement.
Nearest support levels:
S1 - 1.0986
S2 - 1.0864
S3 - 1.0742
Nearest resistance levels:
R1 - 1.1108
R2 - 1.1230
R3 - 1.1353
Trading recommendations:
The EUR/USD pair remains above the moving average line, but we still do not see reasons for further growth. The price has surpassed the psychological level of $1.10, so the upward trend persists, and the euro may continue to move north. The overbought condition of the CCI indicator still indicates the excessively high cost of the euro. However, there are no signals of a trend reversal, so you can remain in long positions with targets at 1.1173 and 1.1230. Short positions can be considered when the price consolidates below the moving average with a target of at least 1.0864.
Explanations for the illustrations:
Linear regression channels - help determine the current trend. If both point in the same direction, the trend is currently strong.
The moving average line (settings 20.0, smoothed) - determines the short-term trend and the direction in which trading should be conducted.
Murray levels - target levels for movements and corrections.
Volatility levels (red lines) - the likely price range the pair will move in the next day based on current volatility indicators.
CCI indicator - its entry into the oversold area (below -250) or overbought area (above +250) indicates an impending trend reversal in the opposite direction.