Analysis of GBP/USD 5M
GBP/USD continued its upward movement on Wednesday. No event could have influenced the market to buy the British pound, as the only event on Wednesday was the US inflation report. This report did not serve as an impetus to sell the US dollar. As forecasted, headline inflation eased to 3.4% from a year ago, and core inflation slowed as forecasted to 3.6% year-over-year. In both cases, the current inflation level is so high that the Federal Reserve still cannot even begin to discuss monetary policy easing. Both inflation values matched the forecasts. These values do not guarantee that inflation will resume the downward trend. Therefore, it was illogical for the pound to rise on Wednesday. But who is surprised by this?
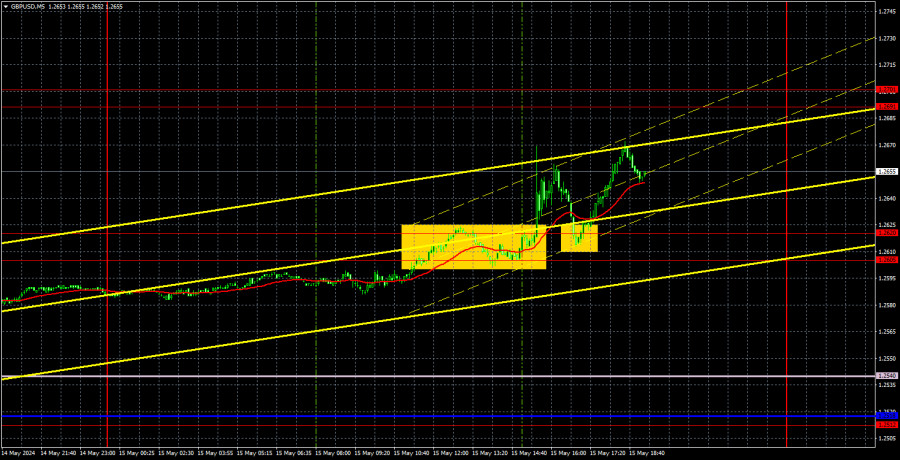
The pound sterling has been rising since April 22. For a while, it seemed that it had found its place within another sideways channel, but yesterday the price effortlessly broke through the 1.2605-1.2620 area and surged. Even if we assume that the market had a justified reaction to the inflation report, since when does the dollar plummet due to a 0.1% change in the indicator? In general, we stick to the same opinion. The pair can continue to rise for as long as it wants, but this movement has nothing to do with the fundamental and macroeconomic background.
Two buy signals were formed on the 5-minute timeframe. First, the pair overcame the 1.2605-1.2620 area, and then it bounced off it from above. As with the euro, the first signal was quite difficult to catch as the price instantly soared. However, not only was it possible to execute the second buy signal, but it also yielded profits—at least 35-40 pips.
COT report:
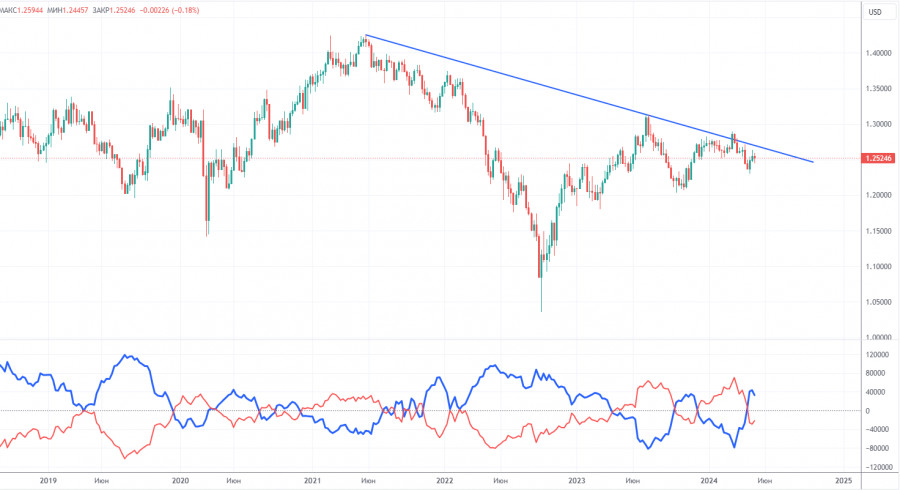
COT reports on the British pound show that the sentiment of commercial traders often changes in recent years. The red and blue lines, which represent the net positions of commercial and non-commercial traders, constantly intersect and, in most cases, remain close to the zero mark. According to the latest report on the British pound, the non-commercial group opened 8,100 buy contracts and 900 short ones. As a result, the net position of non-commercial traders increased by 7,200 contracts in a week. Sellers continue to hold their ground, but they have a small advantage. The fundamental background still does not provide a basis for long-term purchases of the pound sterling, and the currency finally has a real chance to resume the global downward trend. The trend line on the 24-hour TF clearly shows this. Almost all of the factors point to the pound's decline.
The non-commercial group currently has a total of 51,800 buy contracts and 73,600 sell contracts. Now the bears are in control and the pound has a huge potential to fall. We can only hope that inflation in the UK does not accelerate, or that the Bank of England will not intervene.
Analysis of GBP/USD 1H
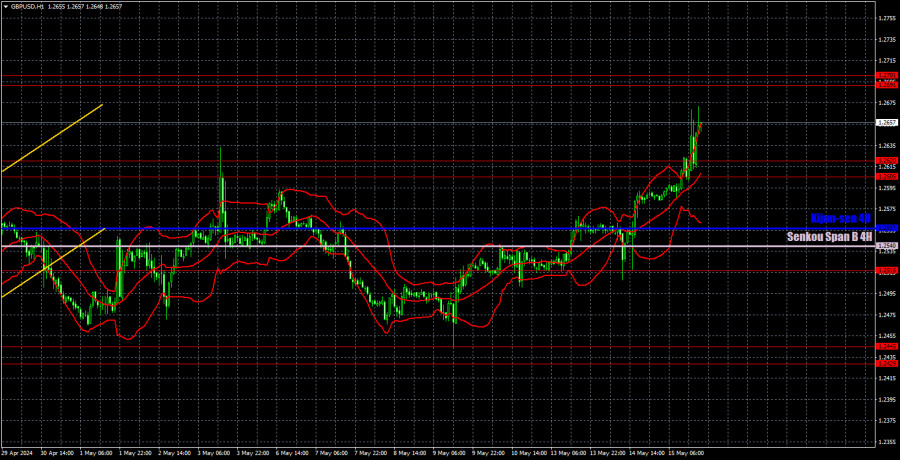
On the 1H chart, GBP/USD continues to go through a bullish correction, which could turn into anything. The price easily overcame the 1.2605-1.2620 area on the second attempt. The British pound continues to show that the market is willing to buy regardless of the fundamental and macroeconomic background. Therefore, the pair's movement is illogical, so it's pointless to try to look for any patterns.
As of May 16, we highlight the following important levels: 1.2215, 1.2269, 1.2349, 1.2429-1.2445, 1.2516, 1.2605-1.2620, 1.2691-1.2701, 1.2786, 1.2863, 1.2981-1.2987. The Senkou Span B (1.2540) and Kijun-sen (1.2557) lines can also serve as sources of signals. Don't forget to set a Stop Loss to breakeven if the price has moved in the intended direction by 20 pips. The Ichimoku indicator lines may move during the day, so this should be taken into account when determining trading signals.
On Thursday, no significant events are scheduled in the UK. The US docket will only feature secondary data on building permits and industrial production. The market is currently buying the pair without regard for news, reports, or speeches by Powell and his colleagues. Therefore, the actual values of today's reports are irrelevant.
Description of the chart:
Support and resistance levels are thick red lines near which the trend may end. They do not provide trading signals;
The Kijun-sen and Senkou Span B lines are the lines of the Ichimoku indicator, plotted to the 1H timeframe from the 4H one. They provide trading signals;
Extreme levels are thin red lines from which the price bounced earlier. They provide trading signals;
Yellow lines are trend lines, trend channels, and any other technical patterns;
Indicator 1 on the COT charts is the net position size for each category of traders;


