GBP/USD
Analysis:
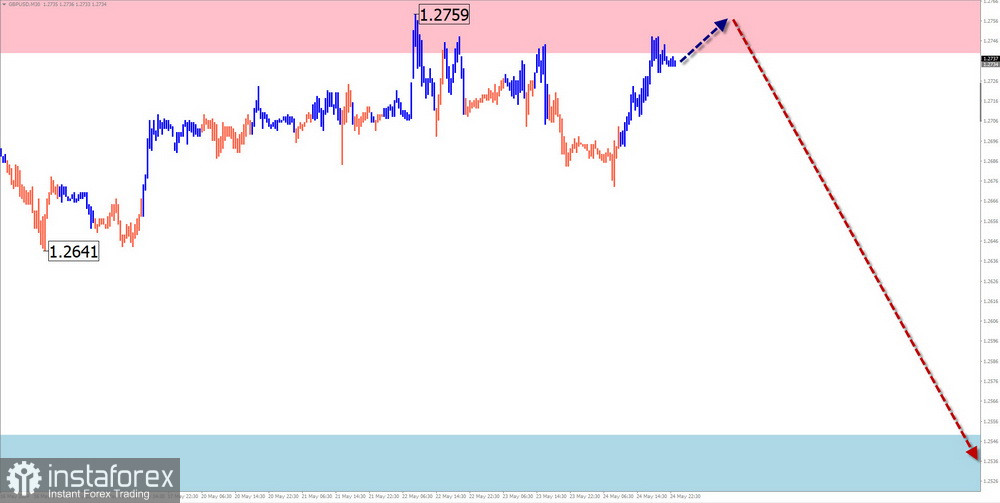
Since March this year, the trend of the major British pound has been upward. Since early April, the price has been drifting. The final part of the corrective structure still needs to be completed. The price has broken through the intermediate support level on the daily timeframe. To continue the wave, the price needs to consolidate below this zone.
Forecast:
In the upcoming week, a continuation of the general sideways movement of the British pound is expected. Early in the week, an upward vector is likely, with possible pressure on the upper boundary of the resistance zone. Subsequently, a reversal and price decline towards the support area can be expected. A further downward breakthrough is unlikely.
Potential Reversal Zones:
- Resistance: 1.2740/1.2790
- Support: 1.2550/1.2500
Recommendations:
- Selling: It is possible with a reduced lot. Optimal selling signals should be monitored near the calculated resistance. Support limits potential.
- Buying: This may be risky for the account.
AUD/USD
Analysis:
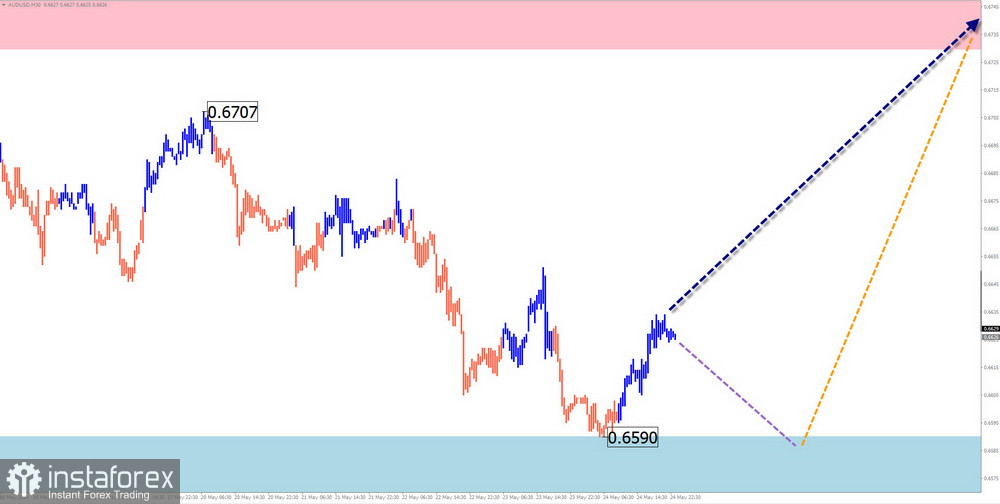
Since July last year, a descending wave zigzag has been forming on the daily scale of the Australian dollar chart. Extremes on the chart form a horizontal pennant. An intermediate correction segment is forming within the final part (C). Two weeks ago, the price broke through strong resistance and is now retracing downwards, forming a correction.
Forecast:
A flat movement along the support zone is likely in the early days of the upcoming week. Then, the likelihood of a reversal and course change increases. The highest activity is expected closer to the weekend. The resistance zone shows the upper boundary of the pair's expected weekly range.
Potential Reversal Zones:
- Resistance: 0.6730/0.6780
- Support: 0.6590/0.6540
Recommendations:
- Buying: Possible with a reduced trading lot when signals appear near the support zone.
- Selling: This may cause losses in the coming days. It is optimal to refrain from such trades.
USD/CHF
Analysis:
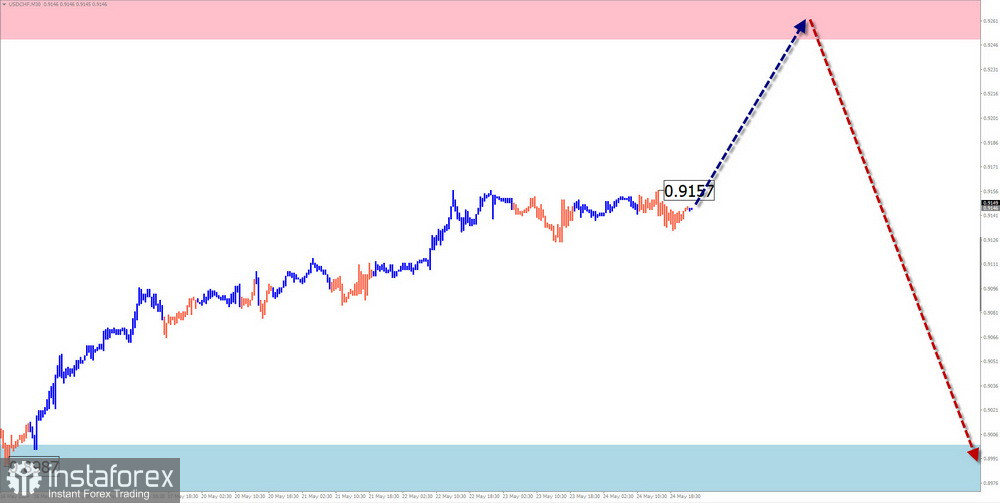
The trend of the dominant bullish wave of the major Swiss franc since December last year has brought the pair close to the lower boundary of the potential reversal zone on the weekly timeframe. Throughout the current month, the price has been drifting between the boundaries of this zone, forming a horizontal channel.
Forecast:
Continued growth and attempts to pressure the resistance are likely early next week. In the following days, a reversal formation can be expected. A brief breach of the upper boundary of the zone cannot be ruled out. A resumption of the decline is expected closer to the weekend.
Potential Reversal Zones:
- Resistance: 0.9250/0.9300
- Support: 0.9000/0.8950
Recommendations:
- Buying: Possible with a fractional lot within individual sessions.
- Selling: Such trades may cause losses until confirmed reversal signals appear near the resistance zone.
EUR/JPY
Analysis:
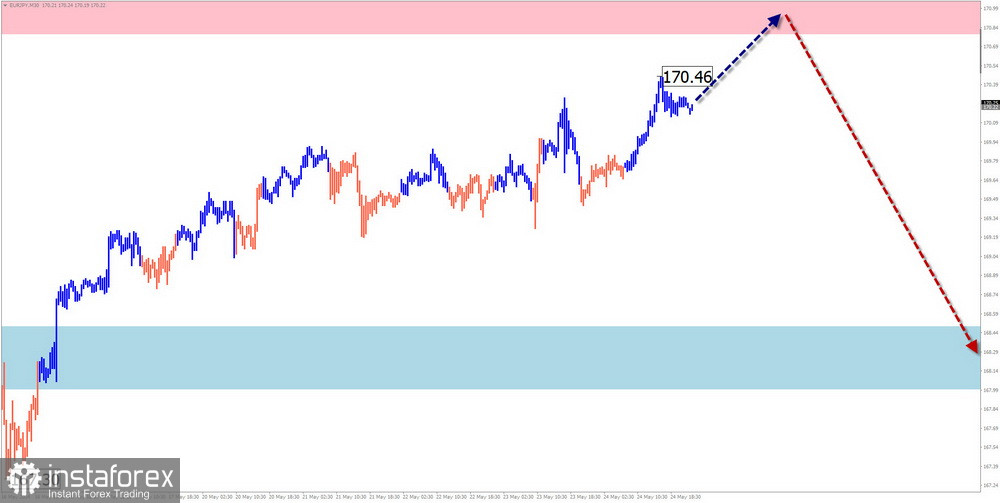
In the short term, the descending wave algorithm has been setting the trend direction of the EUR/JPY cross pair since April 29. Analysis of the structure shows the development of a shifting plane, with the middle part (B) forming. The price is approaching the lower boundary of the intermediate potential reversal zone. There are no signals of an imminent change in direction on the chart.
Forecast:
Early next week, a generally flat movement is expected. In the first few days, a predominantly bullish vector is likely. In the second half of the week, increased volatility, a reversal, and a resumption of the decline are highly probable. The calculated counter-direction zones show the boundaries of the pair's likely range.
Potential Reversal Zones:
- Resistance: 170.80/171.30
- Support: 168.50/168.00
Recommendations:
- Buying: Possible only within individual sessions with a fractional lot. The potential is limited by resistance.
- Selling: Premature until reversal signals appear near the resistance zone.
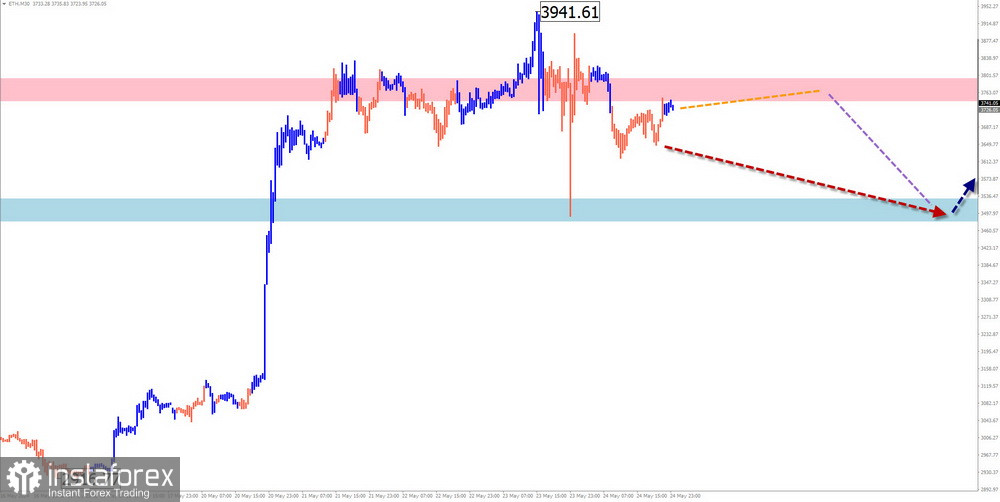
#Ethereum
Analysis:
Since October last year, the Ethereum chart has shown a trend towards active growth. Analysis of the structure of the last wave shows the completion of the final part (C). The descending segment from May 23 has reversal potential. Upon confirmation, a change in the short-term trend direction can be expected.
Forecast:
The sideways movement that has persisted for the past week is expected to continue in the upcoming week. Brief pressure on the resistance zone is possible, and a brief breach of the upper boundary of the support zone cannot be excluded. By the end of the week, the likelihood of a trend reversal and the beginning of a decline increases.
Potential Reversal Zones:
- Resistance: 3750.0/3800.0
- Support: 3530.0/3480.0
Recommendations:
- Buying: Risky and lacks potential.
- Selling: This can be used within individual sessions with a fractional lot after reversal signals appear. Support limits the potential.
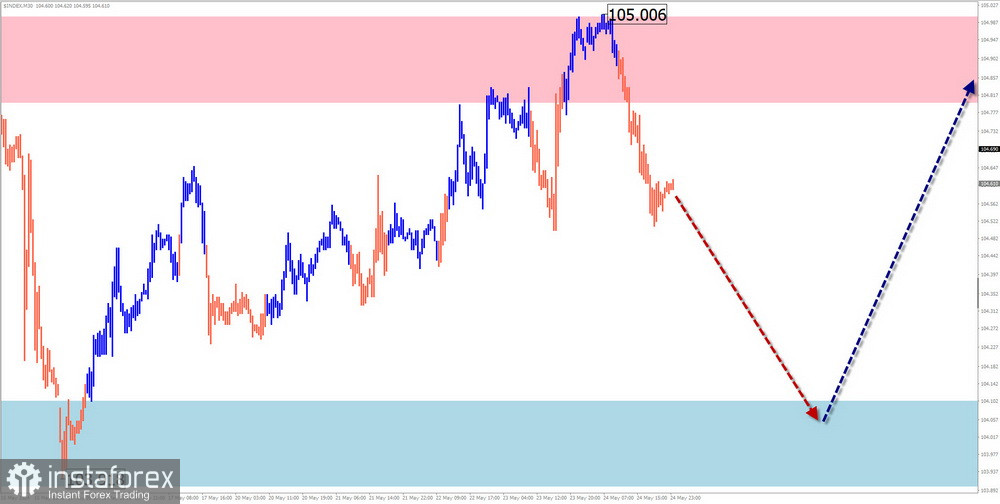
US dollar index
Analysis:
In the context of the dominant bullish wave of the dollar index, the unfinished segment by the main course is counted from May 16. Since last week, the quotes on the chart have formed a correction in the form of a shifting plane. During analysis, the price is in a narrow corridor between several support/resistance levels of different scales.
Forecast:
Next week, a continuation of the general sideways movement of the index is expected. A repeated rise can be anticipated after a probable decline to the support zone. The resistance zone will limit the weekly range of dollar movements.
Potential Reversal Zones:
- Resistance: 104.80/105.00
- Support: 104.10/103.90
Recommendations:
The strengthening of the US dollar's position next week will temporarily pause. After the upcoming weakening, a resumption of the upward trend can be expected.
Notes:
- In simplified wave analysis (SWA), all waves consist of three parts (A-B-C). The last unfinished wave is analyzed on each timeframe. Expected movements are shown with dashed lines.
- Warning: The wave algorithm does not account for the duration of instrument movements over time!