For the last trading day, the euro / dollar currency pair again showed high volatility of 93 points, where, as a result, the inertial move persisted, returning the quote to the levels that had been completed earlier. From the point of view of technical analysis, we see a significant gulf of long positions, and the total jump from the point of support 1.1180 is already more than 130 points, I note without any significant recoils or corrections. For a speculative interest, this is the only theory of experts, which in principle justifies this kind of movement. Considering the trading chart in general terms, we see that the global downward trend is still on the market and the quotation is within its upper limit.
We turn to the informational - news background and we see that yesterday there were no significant statistics on Europe and the US. The only thing that could have been identified was this number of initial claims for receiving unemployment benefits in the US, where there was no significant decrease from 222K to 216K. News, in principle, did not respond to the market.
Today, in terms of the economic calendar, we have data on PMI in Europe and the United States, where, in principle, we do not expect any major changes. At the same time, there are data on sales in the secondary US housing market in May, but even so, the change is not significant: Prev. 5.19M ---> Prog. 5.29M.
The upcoming trading week in terms of the economic calendar is less saturated with statistics in comparison with the past week. The most interesting events are displayed below --->
Tuesday, June 18
United States 14:00 UTC+00 - Sales of new housing (May): Prev. 673K ---> 680K forecast
Wednesday, June 19
United States 12:00 UTC+00 - Basic orders for durable goods (m / m) (May): Prev. 0.0% ---> Forecast 0.2%
Thursday, June 20
United States 12:00 UTC+00 - GDP (q / q) (Q1): Prev. 3.1%
United States 14:00 UTC+00 - Index of pending sales in the real estate market: Prev. -2.0% ---> Forecast -2.6%
Friday, June 21
EU 09:00 UTC+00 - Consumer Price Index (CPI) (y / y) (June): Prev. 1.2% ---> Forecast 1.3%
United States 12:00 UTC+00 - Basic price index for personal consumption expenditure (y / y) (May): Prev. 1.6%
These are preliminary and subject to change.
Further development
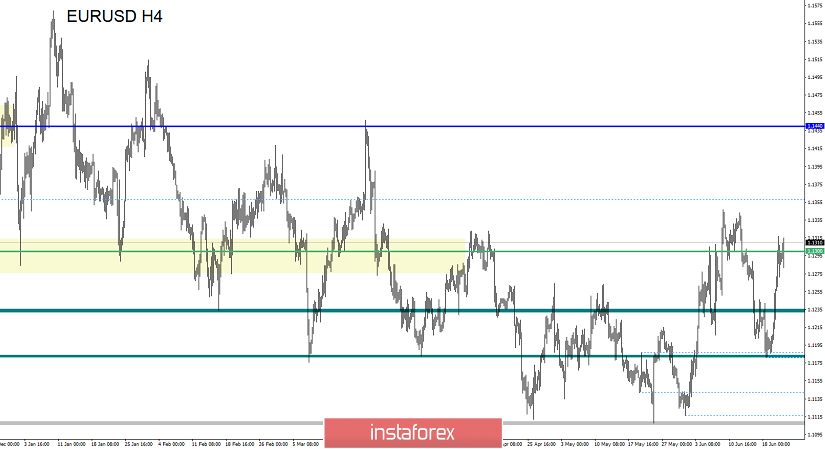
Analyzing the current trading chart, we see that the quotation fluctuates within the level of 1.1300, forming versatile candles of the "doji" type, signaling some uncertainty. The speculative bay, which has already been mentioned several times, leads to sharp overheating and ambiguous fluctuations. Traders who have long positions from the environment have already actively fixed profits. It is likely to assume that this overheating is looking for a point of resistance, which is probably already on the nose. In the form of analysis, values in the form of stagnation within 1.1300 are considered, which we now have. The second point is the maximum of the previous upward stroke 1.1350.
Based on the available information, it is possible to decompose a number of variations, let's consider them:
- Positions for purchase, as I wrote earlier, have been going on for several days and now the process of taking profits is underway. Flying into the position for a possible move to 1.1350, it makes no sense because of the high risk. Any further moves in this direction will be considered already after correction and price fixing higher than 1.1350.
- Positions for sale are considered in several stages: first, relative to the current points, in case of fluctuation, the input is lower than 1.1270. If the price is still able to push to the level of 1.1350, then we are looking for stagnation and enter into the deal with it.
Indicator Analysis
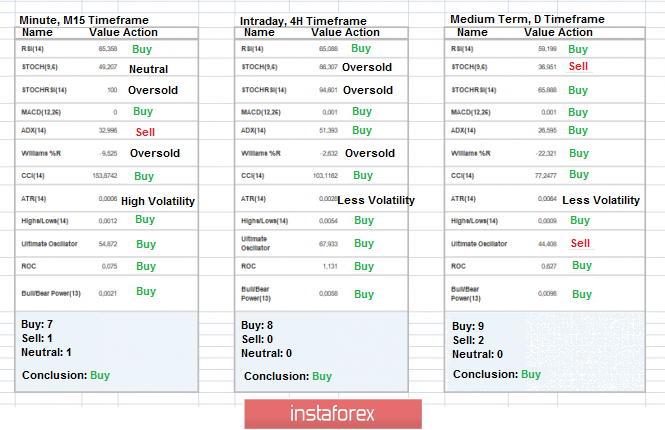
Analyzing a different sector of timeframes (TF), we see that indicators in the short, intraday and medium term, retain an upward interest against the background of the inertial course.
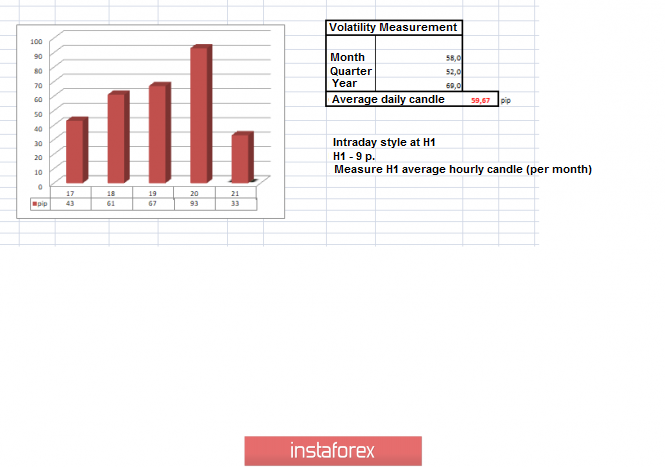
Weekly volatility / Measurement of volatility: Month; Quarter; Year
Measurement of volatility reflects the average daily fluctuation, based on monthly / quarterly / year.
(June 21 was based on the time of publication of the article)
The current time volatility is 33 points. It is likely to assume that volatility can still grow within the average daily indicator.
Key levels
Zones of resistance: 1.1450; 1.1550; 1.1650 *; 1.1720 **; 1.1850 **; 1.2100
Support areas: 1.1300 **; 1.1180 *; 1.1112; 1.1080 *; 1.1000 ***; 1,0850 **
* Periodic level
** Range Level