4-hour timeframe
Amplitude of the last 5 days (high-low): 43p - 39p - 55p - 37p - 64p.
Average volatility over the past 5 days: 48p (average).
The European currency in the confrontation with the US dollar ended the week of October 7-11, relatively calmly, with an increase, but not too strong. In total, the bulls managed to push the pair away from two-year lows by almost 200 points. Yes, this is not too much, and the positions of the bulls still remain extremely precarious, but at least it did. Given the fundamental background of the European Union, such a strengthening is happiness for the euro currency.
On the last trading day of the week, by and large, there was one significant event - a speech by the head of the ECB, Mario Draghi, who, recall, will resign on October 31. He stated that the governments of the EU member states are indirectly to blame for the unprecedented low level of key rates. According to Draghi, if the governments of the EU member states began to spend more, trying to support the economy, this would definitely lead to improved macroeconomic indicators, and the European regulator would not have to resort to its methods of stimulating the economy, one of which is just lowering rates. By and large, such statements by the head of the ECB are aimed at countries that still have a budget surplus, despite the stagnation of the EU economy. We are, of course, talking about the "locomotive" of the EU economy - Germany, as well as the Netherlands. However, the finance ministers of these countries refused Draghi's out of the blue "proposals" to spend more, which is quite logical.
However, Draghi's speech with insinuations about some EU countries remained only interesting news in itself, which had no effect on the movement of the EUR/USD currency pair. One gets the impression that the euro continues to grow only on technical factors, a small negative from the United States (where there are also enough problems), as well as by inertia. Considering the fact that the ECB may well lower rates again in October, as the vice-chairman of the regulator said recently, and now Draghi is hinting that the central bank has to stimulate the EU economy, the picture for the euro remains very unattractive. Not to mention inflation slowing down from month to month ...
In addition, on November 1, a quantitative easing program starts with a total amount of 2.6 trillion euros, almost half of the monetary committee opposed the resumption of which. It was at this point that many experts began to talk about a split in the ranks of the ECB. However, now this is not particularly important, since Christine Lagarde, who will take office on November 1, will have to establish communications with all members of the committee in any case.
Thus, in general, we have a situation where the euro seems to be growing, technical indicators signal an upward movement, volatility remains at an average level, but traders still do not leave doubts about the validity of the euro growth. All the same, there is a feeling that the euro can turn down at any moment and again begin to fall against the US currency. A trade war with the United States looms ahead of the European Union, macroeconomic indicators are falling, monetary policy is "ultra-soft", and the situation is not improving. Thus, we believe that while the Ichimoku indicator signals an upward movement, purchases can be considered. However, overcoming the critical line of Kijun-sen will be the first bell not just for a certain decline in the euro, but for a new downward trend. The only salvation for the euro in the near future is the third consecutive reduction in the Federal Reserve key rate.
Trading recommendations:
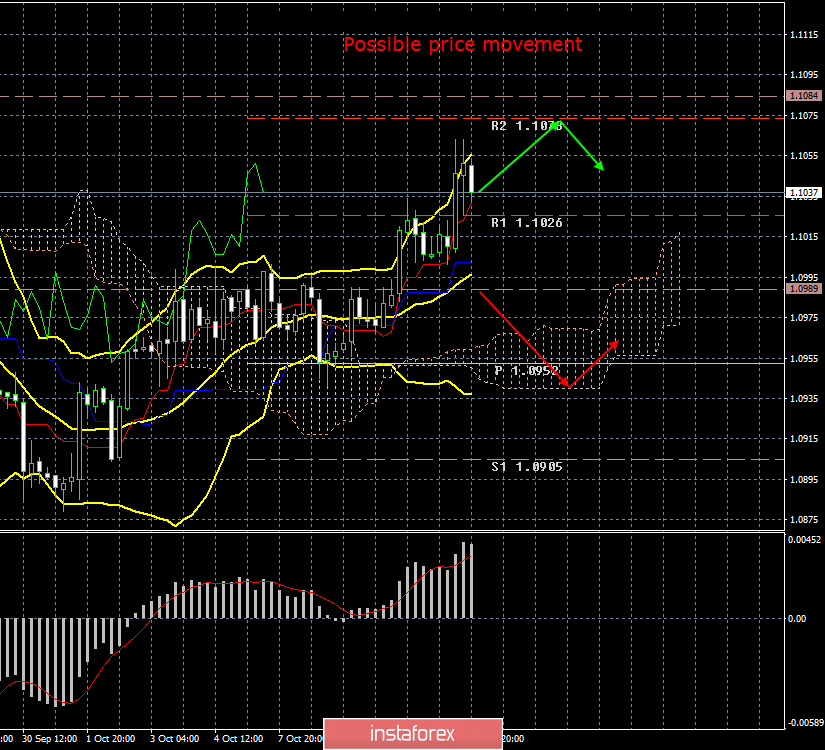
The EUR/USD pair continues to move up. Thus, it is recommended that traders still buy the pair in small lots with goals of 1.1073 and 1.1084. So far, it is not recommended to return to sales, although they are more preferable from the point of view of a long-term fundamental background.
In addition to the technical picture, fundamental data and the time of their release should also be taken into account.
Explanation of the illustration:
Ichimoku indicator:
Tenkan-sen is the red line.
Kijun-sen is the blue line.
Senkou Span A - light brown dotted line.
Senkou Span B - light purple dashed line.
Chikou Span - green line.
Bollinger Bands Indicator:
3 yellow lines.
MACD indicator:
Red line and bar graph with white bars in the indicator window.