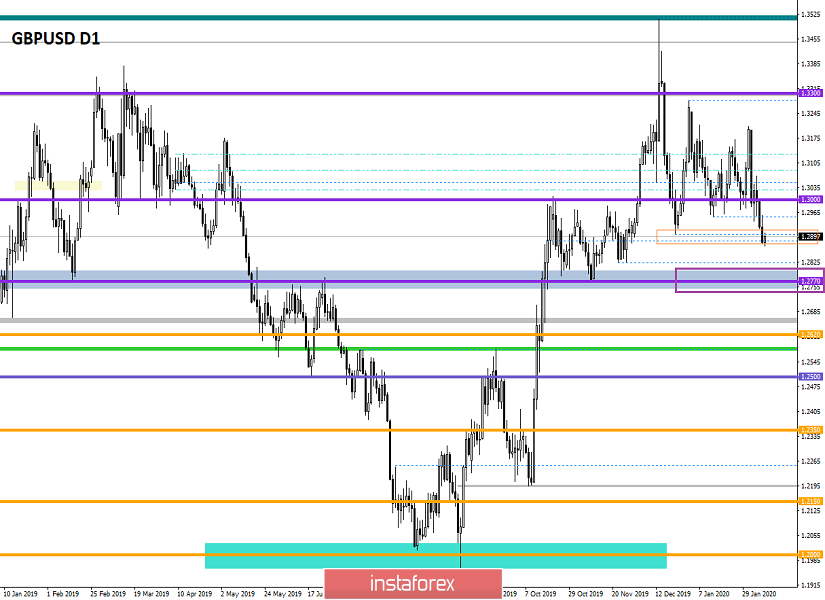
Using complex analysis, we can see attempts of resuming the recovery process, after the quote managed to fix below 1.2900. There were five attempts made, and the long and painful fluctuation within 1.3000 / 1.3300 was left behind when the sellers managed to overcome the psychological level of 1.3000. After the breakdown of the [1.3000] level, the quote did not slow down the previously set course, and it was probably on this hype that we managed to overcome the subsequent control point at 1.2900. Now, the quote has entered the subsequent range of 1.2770 / 1.3000, and only a breakdown of the 1.2770 mark could give a more significant signal of recovery than the current price location.
In terms of volatility, we see similar activity as it was the day before, which reflects the process of fixing prices and a gradual influx of new market participants. This is not a bad deal, since when holding the quote, we can see a full-fledged movement that will interest not only the speculators.
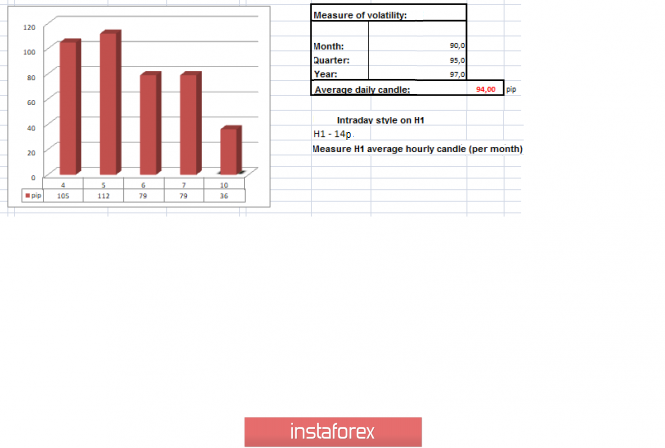
Volatility details: Thursday - 131 points; Friday - 125 points; Monday - 215 points; Tuesday - 105 points; Wednesday - 112 points; Thursday - 79 points; Friday - 79 points. The average daily indicator relative to the volatility dynamics is 95 points [see the volatility table at the end of the article].
Detailing Friday by the minute, we can see that after the temporary flat, there was a period of activity that occurred at 15: 45-16: 15. It was at this very moment that we saw a breakout of the December 23 low [1.2900], and the price moved to the middle of the subsequent range of 1.2770 // 1.2885 // 1.3000.
As discussed in the previous review , many traders already have short positions from the moment the price was fixed below 1.2960. The subsequent gap occurred when the price fixed below 1.2900, so speculators continued to work on catching jumps, which brought them a considerable profit.
Looking at the trading chart in general terms [daily period], we see that the medium-term upward trend is gradually changing its tact. The first signs of a slowdown that we noticed came at the time of the formation of the Zigzag-shaped model, where the upward movement stopped updating the highs, and the quote focused on the range of 1.3000 / 1.3300. The next step in came at the breakdown of 1.3000 and 1.2900, which changed the direction of the upward cycles.
The news background last Friday came from the United States Department of Labor, where they reported that 225,000 new jobs were created. Economists forecasted it to be only at 160,000. Because of this, we saw a more significant increase, as the ADP report coincided with the expectations of the market participants. The growth rate of average hourly wages accelerated from 3.0% to 3.1%, and the unemployment rate increased from 3.5% to 3.6%, as previously predicted. In general, we did not have bad statistical data for the States, and this reflects the growth of the US dollar.
In terms of general information background, we do not have strong bursts of activity. So, the upcoming negotiations between England and Brussels are causing fear for investors, as there are many nuances related to the trade agreement. At the same time, while the issue persists, Prime Minister Boris Johnson is trying to develop Britain's infrastructure, considering building a bridge between Scotland and Northern Ireland, developing the 5G network, and searching for 10 new ports. In fact, these steps lead to the first budget of Britain, which should be provided next month by the Chancellor of the Exchequer Sajid Javid.
Today, in terms of the economic calendar, we do not have significant statistics for Britain and the United States.
Further development
Analyzing the current trading chart, we can see a narrow amplitude fluctuation within the values of 1.2885 / 1.2900, where the concentration of trading forces is quite high. In fact, the quote feels a support in front of it, where long positions appear against the background of local oversold.
Looking at the emotional mood of market participants, we see not just a high coefficient of speculative positions, but an influx of trailers from all sides, which indicates a good state of health of the market.
Detailing the minute-by-minute period of time, we see that with the arrival of the Europeans in the market, the quote of the GBP / USD was revived, where local jumps were recorded, although at a low amplitude.
As a result, traders continue to work downwards, where the average level of 1.2885 plays the role of a temporary support for regrouping trading forces.
Having a general picture of the actions, it is possible to assume that the average level of 1.2885 will play the role of a temporary support, where a local rebound is not excluded. At the same time, due to the revived downward positions, further descents are also not excluded, in the direction of the main coordinate 1.2770. Do not forget that the quote went into the next recovery range of 1.2770 / 1.3000.
Based on the above information, we will output the following trading recommendations:
- Consider buy positions if the price fixes higher than 1.2910, with the prospect of a movement to 1.2960.
- Sell positions are already being held by traders towards 1.2770. If you do not have positions, wait for the price to fix below 1.2870.
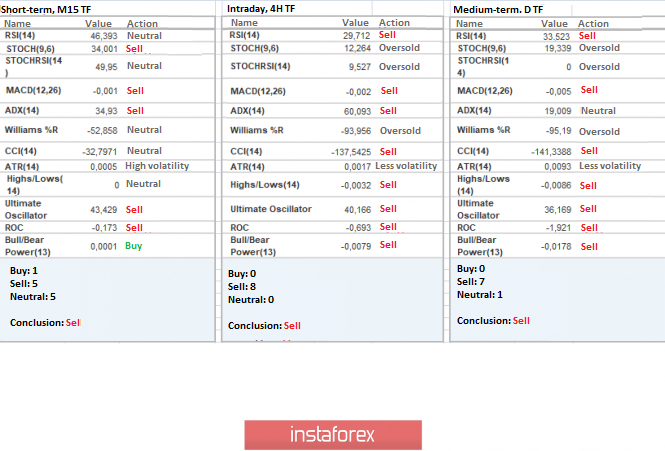
Indicator analysis
Analyzing the different sectors of timeframes (TF), we can deduce that the indicators of technical instruments still occupy the downward side, signaling a sale.
Volatility for the week / Volatility Measurement: Month; Quarter year
The volatility measurement reflects the average daily fluctuation, based on the calculation for the Month / Quarter / Year.
(February 10 was based on the time of publication of the article)
The volatility at the moment is 36 points, which is a low value for this time period. It is possible that if there is no stagnation or a small pullback, there will be an accelerating volatility.
Key level
Resistance zones: 1,2900*; 1,3000; 1,3170**; 1,3300**; 1,3600; 1,3850; 1,4000***; 1,4350**.
Support areas: 1,2900*; 1,2885*; 1,2770**; 1,2700*; 1,2620; 1,2580*; 1,2500**; 1,2350**; 1,2205(+/- 10p.)*; 1,2150**; 1,2000***; 1,1700; 1,1475**.
* Periodic level
** Range level
***Psychological level
**** The article is based on the principle of conducting a transaction, with daily adjustments