From a comprehensive analysis, we see a breakdown of the 2019 minimum, where the quote managed to be fixed below the value of 1.0879, and now about the details. So, this is the moment when the oblong correction was fully worked out, which lasted almost 4.5 months. During this time, many traders have lost faith in the original trend, even though their judgment was wrong in the end. Is it worth waiting for the continuation of the banquet? Yes, it's worth it and we already wrote about this in the previous review.
Here we should not rush to conclusions since the characteristic pressure from psychological ranges cuts all rash speculative interest to the root. In this case, we should work with the entire external background that is gathering in the vast eurozone. It is about the deterioration of macroeconomic indicators, paired with the pressure of the information background. In this case, the technical component will play an excellent role as a sight, where exactly we will go down.
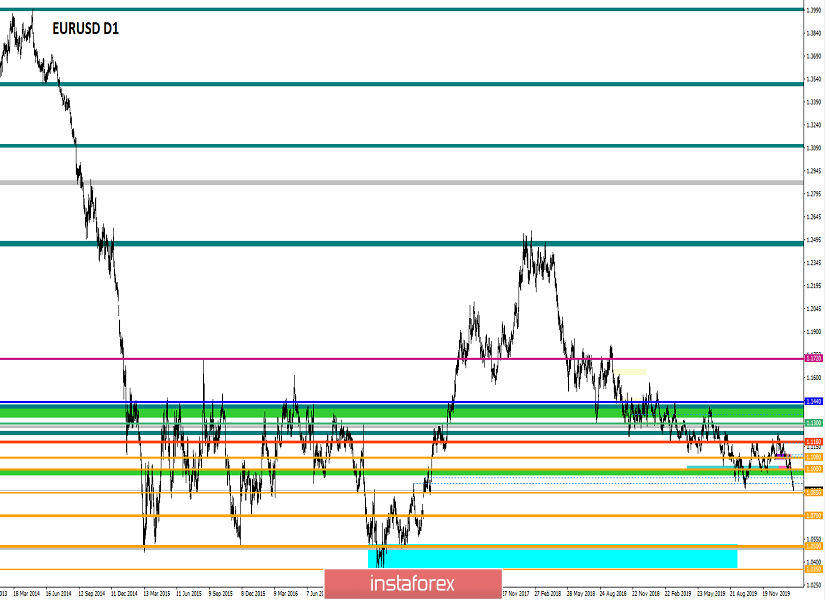
If we talk about high, then we have ambitious plans for reducing, so special attention is paid to the following ranges: 1.0700/1.0850; 1.0500/1.0700; 1.0000//1.0350//1.0500, where the price will consistently interact with the cardinals, forming certain amplitudes. There is no need to wait for a fleeting descent or reaction in the next few days and this prospect is for the whole of 2020 if our theory is fulfilled. At the same time, no one can guarantee that the quote will fall as low as 1.0000, where everyone will give one euro for one dollar. Also, there is a fine line of geopolitics, and only the market knows how the leaders will behave in this situation.
All that remains for us is to observe from the side and skim the cream at the right time, which we have been doing for a long time.
In terms of volatility, we see a characteristic acceleration, about 30% relative to the daily average and 88% compared to the day before. In this case, the acceleration is due to the final breakdown of the minimum of 1.0879.
Analyzing the trading chart every minute, we see that the quote moved conditionally horizontally for 45 hours, having a variable range of 20-30 points, where there was an acceleration in the end, which broke the last year's minimum of 1.0879. You can understand how much pressure was on market participants if we stayed in the same place for almost two days. The minimum was still passed, which means that it is still possible, including visits to the psychological ranges.
Details: 45 hours stagnation - 1.0905/1.0925; Acceleration - 16:30-21:00 (12.02.20); the minimum mark during the breakdown - 1.0865.
As discussed in the previous review, traders mostly fixed previously opened short positions at the moment of 45-hour standstill due to the risk of a rebound from a minimum of 1.0879. The subsequent gulf in short positions was expected at the time of the passage of the area of 1.0880-1.0850. At the same time, speculators could not miss such a long stagnation and waited for such a development. For this reason, we emphasize trading on the breakdown, which brought a little profit.
Looking at the trading chart in general terms (the daily period), we see that the quote is on the verge of collision with psychological ranges, where the values of 2017 have already been set.
The news background of the previous day was absent in terms of statistics from Europe and the United States.
In terms of the general information background, we have interesting facts about the long-term prospects of the European economy. So, following a recent statement by the head of the European Commission, Ursula von der Leyen, Brexit will form a hole in the European budget of 75 billion euros in the period between 2021 and 2027. At the same time, the head of the European Central Bank (ECB), Christine Lagarde, speaking in the European Parliament the other day, spoke about the side effects of the ECB's soft monetary policy, which negatively affects the income from savings and pushes up asset prices.
"We are fully aware that a low interest rate environment affects savings income, asset valuations, risk appetite, and house prices. The ECB is closely monitoring the potential for negative side effects so that they do not negate the positive impact of our measures on credit conditions, job creation and wages," said Christine Lagarde.
The head of the ECB also called on the governments of the eurozone to take measures to stimulate economic recovery.
I think you understand everything. The foundation is on the downward trend side.
Today, in terms of the economic calendar, we have data on inflation in the United States, which is projected to grow from 2.3% to 2.4%. In fact, this is a signal that the Fed will not lower the rate.
USA 14:30 London time - Inflation
Further development
Analyzing the current trading chart, we see that after a slight fluctuation, the quote returned to the minimum of the previous day, while showing a desire to resume the downward course. In fact, the breakdown of the value of 1.0865 is a convention. And we are more interested in the coordinates of 1.0850 since fixing (H4) behind its aisles would give a signal about furthermore significant progress.
Detailing the available period every minute, we see that the overnight consolidation of 1.0865/1.0876 was initially broken in the upward direction, which was quite normal due to the regrouping of trade forces, paired with data on inflation in Germany. After that, everything returned to normal, where a small impulse moves us again at the minimum values.
In terms of the emotional mood of market participants, we see not just a speculative mood but a general one, where new prospects opened up due to the breakdown of the 2019 minimum, followed by market excitement.
In turn, traders are waiting for the price to be fixed below the value of 1.0850 since there will be good prospects for a decline.
It is likely to assume that the characteristic pressure will torment market participants, and there is no escape from it, even after the breakdown of the mark of 1.0850. Now we are more interested in how the quote will behave, how long the fixing process will take, and when we will see the passage of the mark of 1.0850. You understand that everyone is at a low start, and the prospects are considerable, as well as the possible income.
Based on the above information, we will output trading recommendations:
- Buy positions will be considered in case of local jumps, which will be interesting for speculators. The possible entry point is 1.0900, with a perspective of 1.0925.
- We consider selling positions if the price is fixed below 1.0850 (H4), the main positions. Speculative positions from 1.0864 to 1.0850.
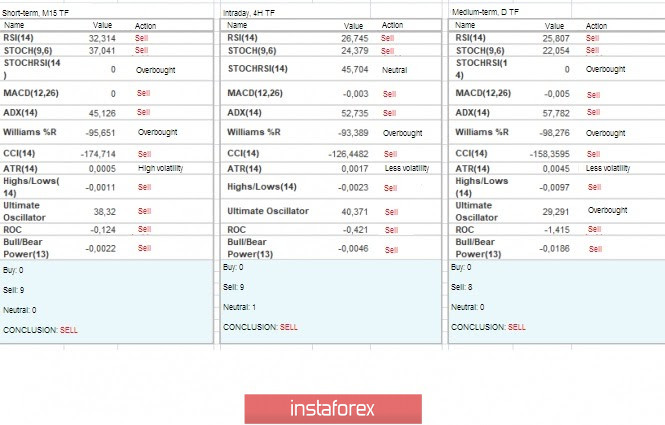
Indicator analysis
Analyzing different sectors of timeframes (TF), we see that the indicators of technical instruments unanimously signal sales, thus reflecting the general background of the market.
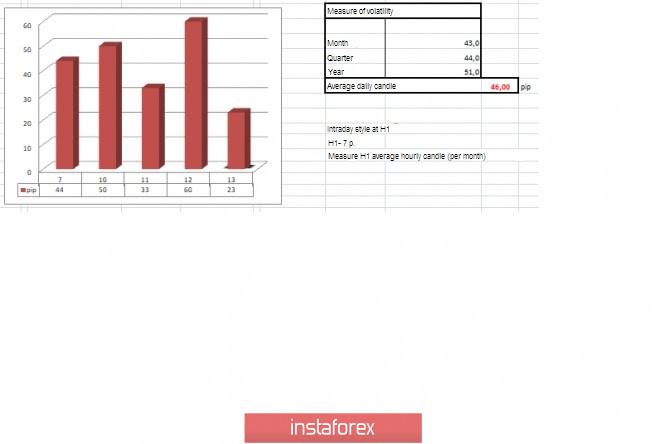
Volatility for the week / Volatility Measurement: Month; Quarter; Year.
The volatility measurement reflects the average daily fluctuation, based on the calculation for the Month / Quarter / Year.
(February 13 was based on the time of publication of the article)
The volatility of the current time is 23 points, which is a low value but everything is just beginning. It is likely to assume that against the background of the accumulation, as well as data on inflation in the US, we can see a local acceleration with a rise in volatility.
Key levels
Resistance zones: 1.0900/1.0950**;1.1000***; 1.1080**; 1.1180; 1.1300**; 1.1450; 1.1550; 1.1650*; 1.1720**; 1.1850**; 1.2100.
Support zones: 1.0879*; 1.0850**; 1.0500***; 1.0350**; 1.0000***.
* Periodic level
** Range level
*** Psychological level
***** The article is based on the principle of conducting a transaction, with daily adjustments.