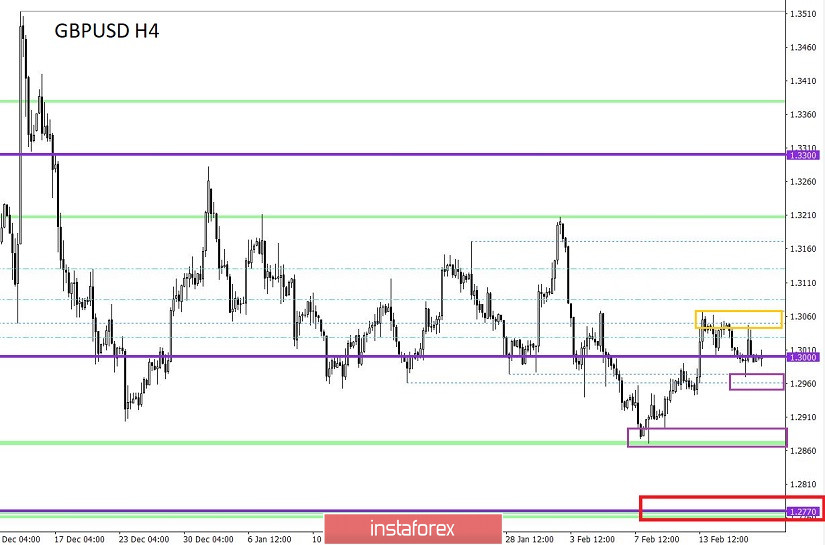
From the point of view of a comprehensive analysis, we see the concentration of trading forces within the psychological level of 1.3000, and now let's talk about the details. The oscillation within the control level has been going on for two and a half days, where the resistance point invariably reflects the 1.3060 region, and the fulcrum is the level of 1.3000 with a deviation of 15-30 points. In fact, the existing fluctuation with the lack of new heights confirms the fact that there are enough sellers on the market who are consistently moving towards a given goal.
Regarding the theory of the downward movement, we continue to consider a more significant decrease, which first reflects the recovery process, and only subsequently, the resumption of the main trend. The process is not fast, but expects to be profitable when confirming the theory where medium-term traders have already taken a downward position with control of possible risks.
What are the prospects?
The recovery process reflects the movement in the structure of the medium-term upward trend [09/03/19-13.12.19], where approximately 39% was worked out on February 10. To confirm this theory, we need to fix below the level of 1.2770, which will display a development of more than 50% relative to the medium-term move.
The resumption of the global downward trend will occur at the moment the price is fixed lower than the base point of the medium-term upward trend - coordinates 1.1957.
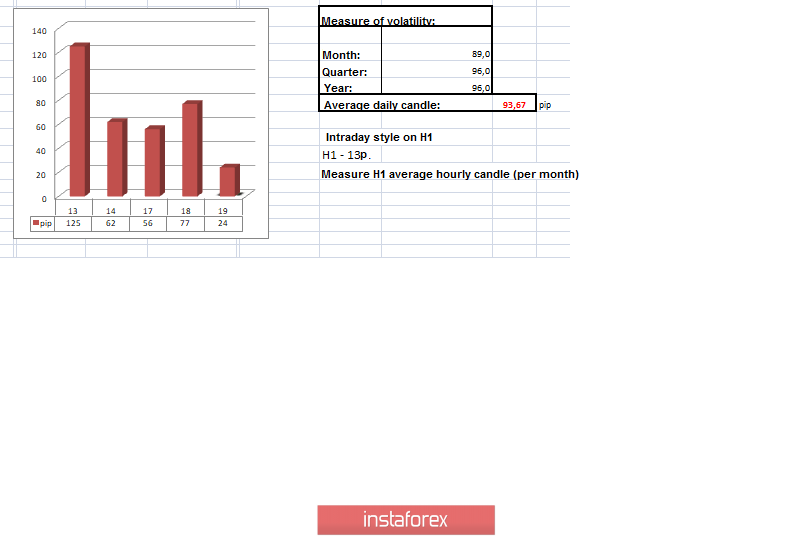
In terms of volatility, we see an interesting picture, and so, the activity indicator came to the values of last week again. In fact, this is a kind of confirmation of the change in tact, where market participants are trying to gather as many followers as possible to fix prices at new levels.
Details of volatility: Thursday - 79 points; Friday - 79 points; Monday - 74 points; Tuesday - 74 points; Wednesday - 44 points; Thursday - 125 points; Friday - 62 points; Monday - 56 points; Tuesday - 77 points. The average daily indicator relative to the dynamics of volatility is 93 points [see table of volatility at the end of the article].
Detailing minute by minute, we see that the main surge of activity occurred in the period 8:00–10:00 [UTC+00 time on the trading terminal]. After which, the recovery process began almost immediately, returning the quote to the level of 1.3000 with a concentration on it.
As discussed in the previous review, medium-term and intraday traders tend to sell positions, which, in principle, is logical. At the same time, speculators focused on a surge of local activity.
Considering the trading chart in general terms [the daily period], we see that the medium-term trend is not going through the best of times. The last update of the maximum took place in December, while the current decline to around 1.2885 indicates a change in tact.
The news background of the past day contained data on the labor market in the United Kingdom, where they came out slightly better than expected, but still remained bad. So, the unemployment rate for the fourth consecutive month remains at 3.8%, which is very alarming. The average wage level slowed even more than expected: excluding premiums from 3.4% to 3.2%; including premiums from 3.2% to 2.9%. The optimistic indicators were the data on applications for unemployment benefits, which reflected an increase of only 5.5 thousand applications instead of 22.6 thousand, as previously predicted, and the previous data was reviewed for the better. On the other hand, employment data, which increased by 180 thousand with a forecast of 120 thousand, did not go unnoticed.
The reaction of the market was in terms of local strengthening of the pound, but not for long.
In terms of the general informational background, we continue to record the noise associated with the upcoming negotiations between the EU and Britain, where comments regarding the structure of the transaction, the conditions and the order of regulations are poured on a daily basis. This time, the European Union's chief negotiator for Brexit Michel Barnier gave his comment, who tried once again to convey to London the idea that the deals cannot be the same and it is not worth comparing everything with other countries where there are already deals.
"We, as before, are ready to offer the UK an ambitious partnership. A trade deal that will include, in particular, fishing and equal conditions with a country that has a special affinity - unique territorial and economic affinity - therefore it (agreement - ed.) cannot be compared with Canada, South Korea or Japan," said Michel Barnier.
Today, in terms of the economic calendar, we have data on inflation in the UK, where they expect growth from 1.3% to 1.4%, which may support the pound if the growth forecast is confirmed. In the afternoon, there will be data on producer prices in the United States, where they expect growth from 1.3% to 1.7%., But then we get data on the construction sector, where the data is by no means good. The volume of construction of new houses in January declined by 30.7%, (forecast), and the number of building permits issued remained virtually unchanged.
Further development
Analyzing the current trading chart, we see the concentration of trading forces within the psychological level of 1.3000, where the narrow amplitude fluctuation is still relevant. In fact, the very fluctuation between 1.000 (-30pip) / 1.3060 is still on the market, and this is almost the third day in a row. The main prospects remain unchanged, but the local ones are still focused on this range.
From the point of view of the emotional mood, we see that speculators are trying to take advantage of the existing situation by working on impulses. In turn, the signs of a breakdown in the clock component returned a lot of participants to the market, which will become even more in the near future.
By detailing the per-minute time span, we see a narrow consolidation along the level of 1.3000, where the quote is trying to take advantage of the situation in anticipation of inflation data.
In turn, medium-term traders are not afraid of stagnation; prospects are designed for a much longer period. At the same time, intraday traders work both within the range and for its breakdown. In the first place, speculators are eyeing impulses to enter the market.
Having a general picture of actions, it is possible to assume that the theory of the downward trend is relevant, but it takes time, and most importantly patience is needed to implement it. Now, we are developing in the range of 1.3000 (-30Pip) / 1.3060, where a local movement to the upper boundary is not excluded due to inflation data, but the return will not keep us waiting. Thus, you can consider the value of 1.2970 to enter the main short positions.
Based on the above information, we derive trading recommendations:
- Local purchase positions were considered in case of price fixing higher than 1.305, towards 1.3045-1.3060.
- Positions for sale are already being conducted by traders in the direction of the level of 1.2885-1.2770, a conservative volume per transaction. Meanwhile, intraday operations are considered in case of price fixing lower than 1.2970.
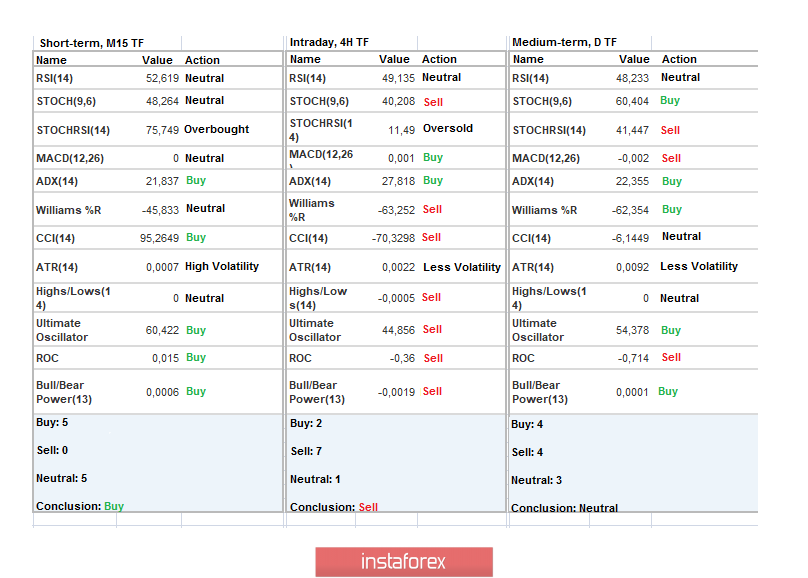
Indicator analysis
Analyzing a different sector of timeframes (TF), we see that the performance of technical instruments became unstable due to the protracted stagnation, signaling a variable interest.
Volatility per week / Measurement of volatility: Month; Quarter; Year
Measurement of volatility reflects the average daily fluctuation, calculated for Month / Quarter / Year.
(February 19 was built taking into account the publication time of the article)
Volatility of the current time is 24 points, which is a low value for a given period of time. It is likely to assume that volatility will remain low, if the boundaries of the main stagnation are maintained.
Key levels
Resistance Zones: 1.3000; 1.3170 **; 1.3300 **; 1.3600; 1.3850; 1.4000 ***; 1.4350 **.
Support Areas: 1,3000; 1.2900 *; 1.2885 *; 1.2770 **; 1.2700 *; 1.2620; 1.2580 *; 1.2500 **; 1.2350 **; 1.2205 (+/- 10p.) *; 1.2150 **; 1,2000 ***; 1.1700; 1.1475 **.
* Periodic level
** Range Level
*** Psychological level
**** The article is built on the principle of conducting a transaction, with daily adjustment