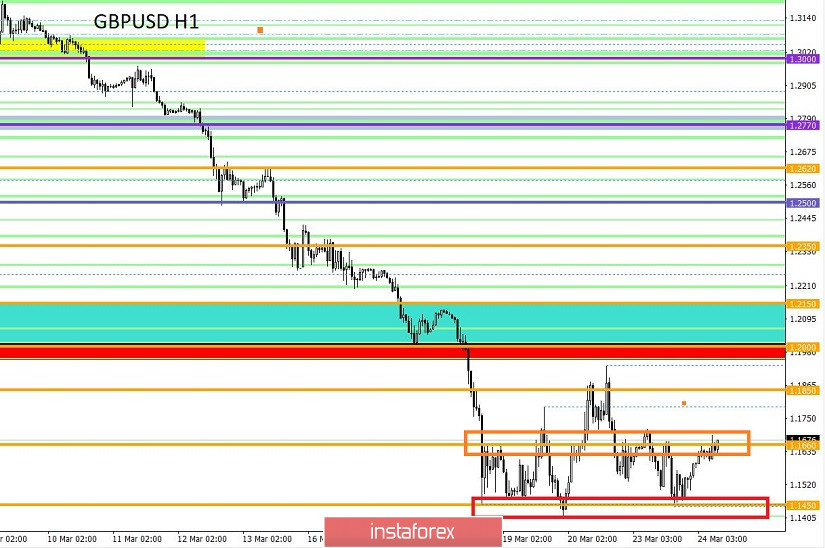
From the point of view of complex analysis, we see another touch of the lower boundary of the variable flat 1.1450, followed by a rebound, and now let's talk about the details. High activity continues to please the speculators, where the quote is in the conditional side range, but the volatility is above average. On the other hand, the slowdown at historical lows has characteristic boundaries: 1.1450 (1.1411) - the basis; 1.1660 - the average level, which reflects the development in the lower part of the range; 1.1850 is the upper deviation, which reflects the maximum value during the deceleration from historical lows. In fact, we are faced with the fact that the base, which has already been tested thrice for strength, puts pressure on the quote, forming a consistent rebound. From another point of view, the desire of sellers to remain in the market is still high.
Regarding the theory of downward development, we see that the area of 1.1411 / 1.1450 became the stumbling block in the existing slowdown, where orders are concentrated, but successive touches still leave a chance for the base to be broken. Thus, although we are at the level of thirty years ago, a further decrease has the basis for reflection due to the growing external background and possible consequences of the virus [COVID-19], which should not be excluded from the analysis.
Concerning the theory of upward development, discussions begin to appear, which is logical with such a significant decline, but at least some arguments for this assumption will appear only after fixing the price higher than 1.2000 and weakening the external background.
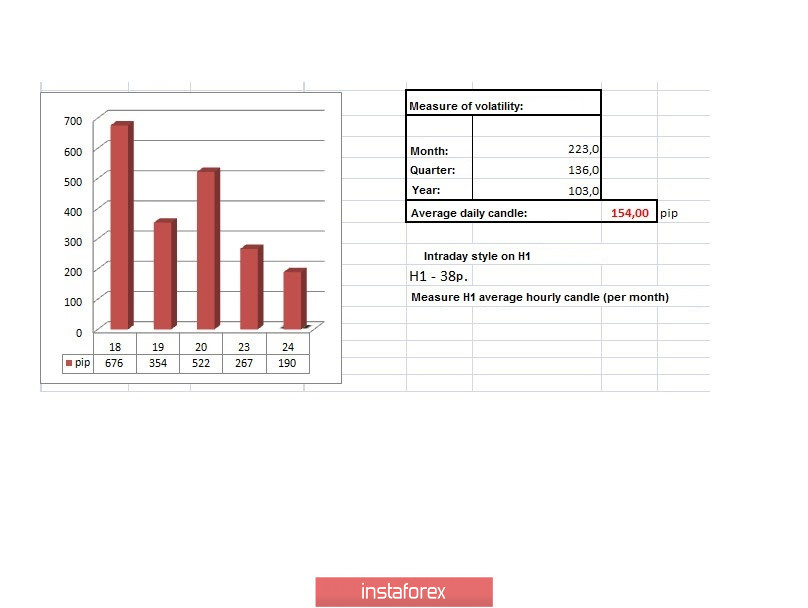
In terms of volatility, we see activity that exceeded the daily average by 73%. The dynamics of the past three days has decreased, but is still at very high values.
Details of volatility: Monday - 165 points; Tuesday - 245 points; Wednesday - 172 points; Thursday - 358 points; Friday - 359 points; Monday - 144 points; Tuesday - 271 points; Wednesday - 676 points; Thursday - 354 points; Friday - 522 points; Monday - 267 points. The average daily indicator, relative to the dynamics of volatility is 154 points [see table of volatility at the end of the article].
By detailing the minute by minute, we see a clock fluctuation inside the 1.1450 / 1.1660 frames, where the descending branches were recorded at the start of the European session, as well as at the start of the American session.
As discussed in a previous review, traders looked at local selling positions in the direction of 1.1450 (1.1411), which brought profit.
Considering the trading chart in general terms [the daily period], we see a global downward trend, where a relatively stagnant inertial course has formed stagnation, which does not yet have a correction status.
The news background of the past day did not have the attention of statistical data for Great Britain and the United States, thereby paying special attention to the analysis of the external background.
In terms of informational background, we see that a wave of coronavirus led to the closure of the United Kingdom to hard quarantine. Thus, the naughty citizens of Britain, who refused to adhere to isolation, provoked the government to take tough control measures, where in one day [Monday] the parliament approved a bill to expand the powers of the authorities during a pandemic. So, the approved bill gives the police and immigration officers, as well as medical workers, the right to detain people who might be infected with the COVID-19 virus, restrict their freedom and fine in case they refuse to take tests for infection. The document also mentions the right to close schools, kindergartens, offices, pubs, shops and the prevention of mass gatherings.
In accordance with the epidemiological situation at 05.00 (Universal time) on 03/24/2020, 380, 457 cases of infection with the COVID-19 virus were recorded in the world, where, in particular, the United Kingdom has 6726 cases of infection, with an increase of 985 per day and casualties of 335, 54 per day.
Today, in terms of the economic calendar, we have preliminary PMI data, where we have a collapse regardless of the country. So, in Britain, the index of business activity in the services sector falls from 53.2 to 44.0, and the production index of business activity may fall from 51.7 to 45.0. In the afternoon, similar data will be released for the United States, where they predict that the index of business activity in the services sector will drop from 49.4 to 40.0, and the production index of business activity will drop to 42.0.
As you know, the data are terrible for both countries, which can lead to local fluctuations within the available ranges.
Further development
Analyzing the current trading chart, we see a fluctuation within the level of 1.1660, where a temporary slowdown is formed. In fact, we have a peculiar pattern, as in the previous period, which gives a signal of a possible downward move, where in case of confirmation of not the best PMI data from Britain, we can get support for short positions. However, it's too early to speak about the main movements, since the price continues to move within 1.1450 // 1.1660 // 1.1850, thus the work is temporarily carried out within the ranges.
From the point of view of the emotional mood of market participants, we see that the external background on a daily basis provides the basis for new leaps, which leads speculators to action. High activity will continue to persist in the markets for a sufficient amount of time.
By detailing the available time interval per minute, we see that the slowdown within 1.1600 / 1.1695 has remained in the market since the Asian trading session.
In turn, traders consider having a slowdown as a possible point for starting jumps, where work can be done to break the boundaries of 1.1600 / 1.1695.
Given the general picture of actions, it can be assumed that, if the pattern coincides from the border of 1.1660, paired with the information and news background, a reverse surge of activity may occur, returning us to the lower border of 1.1450. At the same time, speculators can locally drop the quote up, in the case of the slightest excess of trading forces inside the stagnant 1.1600 / 1.1695.
Based on the above information, we derive trading recommendations:
- We consider buying positions in case of price fixing higher than 1.1720 with the prospect of a move to 1.1790.
- We consider selling positions in case of price fixing lower than 1.1590 with the prospect of a move to 1.1500-1.1450.
Indicator analysis
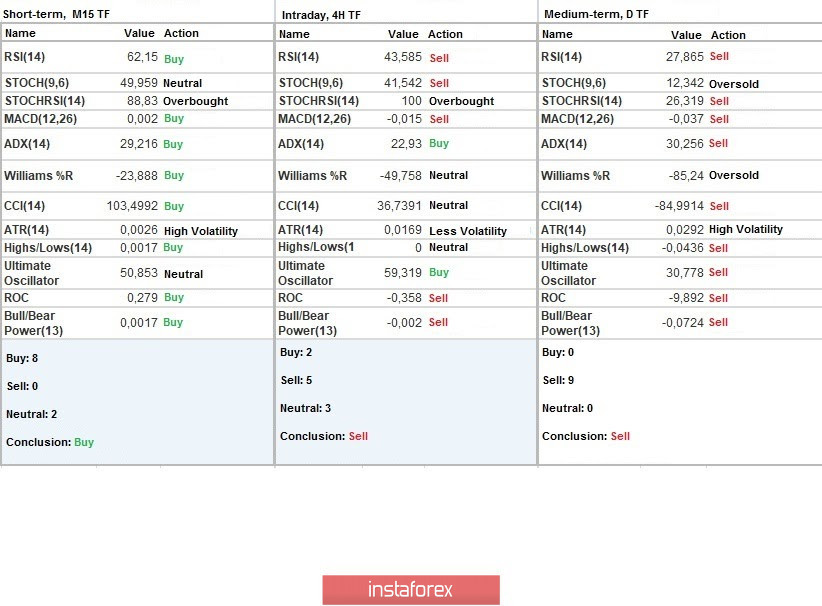
Analyzing a different sector of timeframes (TF), we see that the hourly and daily periods are prone to a downward movement, while the minute ones signal purchases. It is worth considering that due to the price movement within a wide range, the indicators of technical instruments in the short and intraday period adhere to local changes, although the signal is unstable. Meanwhile, daily periods invariably reflect the general interest of the market.
Volatility per week / Measurement of volatility: Month; Quarter; Year
Measurement of volatility reflects the average daily fluctuation, calculated for Month / Quarter / Year.
(March 24 was built taking into account the time of publication of the article)
The volatility of the current time is 190 points, which already exceeds the average daily indicator by 23%. It can be assumed that the external background, paired with upcoming statistics, will give the market new rounds of activity, while continuing to accelerate volatility.
Key levels
Resistance Zones: 1.1660; 1.1850; 1.2000 *** (1.1957); 1.2150 **; 1.2350 **; 1.2500; 1.2620; 1.2725 *; 1.2770 **; 1.2885 *; 1.3000; 1.3170 **; 1.3300 **; 1.3600; 1.3850; 1.4000 ***; 1.4350 **.
Support Zones: 1.1450 (1.1411); 1.1300; 1,1000; 1,0800; 1,0500; 1,0000.
* Periodic level
** Range Level
*** Psychological level
**** The article is built on the principle of conducting a transaction, with daily adjustment