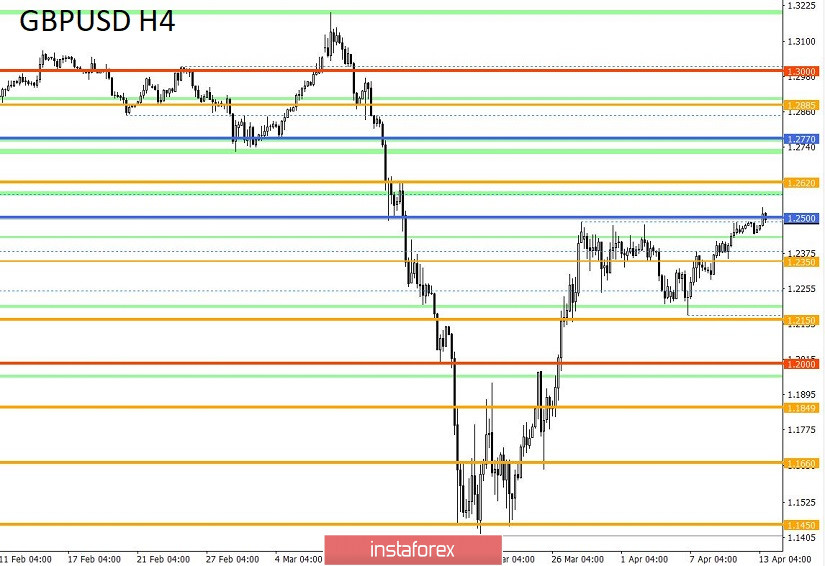
From a complex analysis point of view, we see an upward spiral, in the structure of which a flat was formed. As for the details, the last trading week was expressed in a local upward trend, which reflected the tact of movement within a wide flat 1.2150 / 1.2480 (1.2500). In fact, we had a stepped course, where stagnation was eventually formed within the upper boundary of the main flat.
No fundamental changes have occurred, the quotes focused within the tolerance range, locally showing bursts of activity.
Regarding the theory of further development, there is still no way to firmly set the direction of the medium-term course in connection with a wide flow of information background. Thus, the work on local operations is still relevant, but in the near future, everything may change and by then we will get a clear signal about the direction.
Let me remind you that last week we discussed possible scenarios where we did not rule out that the sterling could again be under pressure due to the impending consequences on the UK economy due to the difficulties of the Brexit agreement and the consequences of the pandemic.
Analyzing the Friday trading day, we see that the quotes spent all available time in a narrow accumulation, having a fluctuation range of 1.2440 / 1.2485.
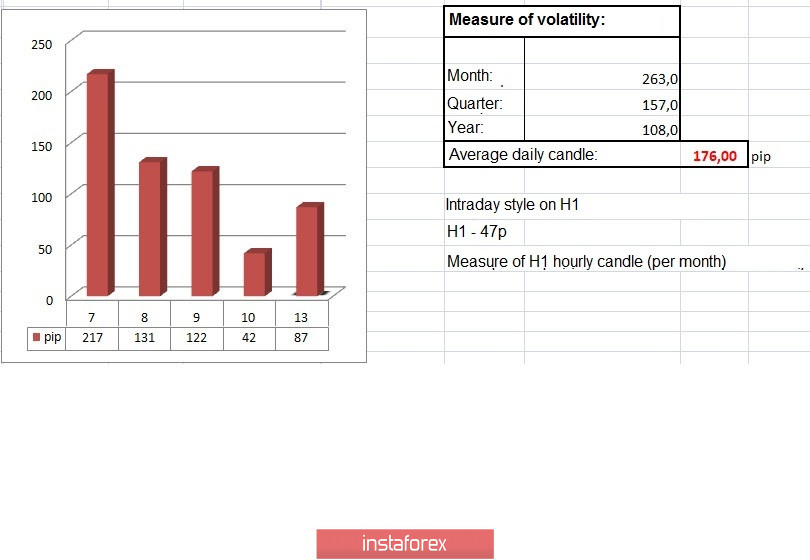
In terms of volatility, we see a sharp decrease of 76% relative to the average daily indicator, where 42 points have not been seen so low in size for a very long time. It can be assumed that the main stimulus for the decline in activity was a day off in the United States, Europe and Britain, in the observance of the Good Friday. At the same time, we were already inclined to believe that the market could adapt to the current external background and show more restrained activity, but in this case there was a decrease in trading volumes.
Details of volatility: Monday - 165 points; Tuesday - 245 points; Wednesday - 172 points; Thursday - 358 points; Friday - 359 points; Monday - 144 points; Tuesday - 271 points; Wednesday - 676 points; Thursday - 354 points; Friday - 522 points; Monday - 267 points; Tuesday - 296 points; Wednesday - 333 points; Thursday - 452 points; Friday - 352 points; Monday - 148 points; Tuesday - 227 points; Wednesday - 108 points; Thursday - 126 points; Friday - 198 points; Monday - 116 points; Tuesday - 217 points; Wednesday - 131 points; Thursday - 122 points; Friday - 42 points;. The daily average, relative to the dynamics of volatility, is 176 points [see the table of volatility at the end of the article].
As discussed in the previous review, traders followed the 1.2440 / 1.2485 accumulation limits, but they did not record a breakdown.
Considering the trading chart in general terms [the daily period], we see two main inertia: DOWN 03.10.20-19.03.20 and UP 03.20.20-27.03.20, where the second inertia developed the first by 65%, and this is a weighty argument for V-shaped model.
Friday's news background contained inflation data in the United States, where expectations coincided with the forecast and we recorded a slowdown from 2.3% to 1.5%. There was no reaction to statistical data, possibly because there was a day off and trading volumes literally lacked in the market. It should be noted that inflation data is one of the indicators of the Federal Reserve's policy of action, and if inflation decreases, then there is a signal of a possible reduction in the refinancing rate.
In terms of the general informational background, we see slightly positive news, the British Prime Minister Boris Johnson, who had previously been diagnosed with the COVID-19 virus and transferred to the intensive care unit, was discharged from the hospital and returned to self- isolation. The United Kingdom itself is still at the peak of the disease, where more than 85 thousand cases of infection have been identified to date, with a death toll of 10,612.
In turn, it is planned to link working groups to address Brexit issues this week, where they will discuss the stages of possible negotiations. Let me remind you that the initiative of Europe regarding the extension of the transition period in connection with the pandemic remained unanswered by England.
Today, the economic calendar in the United Kingdom is empty as well as the entirety of Europe due to the observation of the Bright Monday.
Further development
Analyzing the current trading chart, we see that in the morning period the accumulation of 1.2440 / 1.2485, which lasted throughout Friday, was locally broken upward, consolidating the quotes above the level of 1.2500. In fact, for the first time since March 27, we managed to update the maximum of inertial inertia, however, this time we will talk about a possible breakdown of the upper boundary of the main flat 1.2150 / 1.2480 (1.2500). Acceleration by the breakdown accumulation was recorded, but so far it is similar to a local jump, where speculators literally ate the bar of orders. As you know, you will not go far on speculative activity, so if this is confirmed, then a return to the framework of accumulation will be inevitable.
Parsing the time interval every minute, we see just the very escalation of speculative interest, where at first there was a sharp upward surge, and then recovery with respect to momentum without unnecessary efforts. We can assume that the range 1.2440 / 1.2485 will now play as a support, where it is worthwhile to carefully analyze how the price will behave.
In terms of technical analysis, there was a similar model where accumulation was breaking through locally, but then the price returned to its original frame and overcame the opposite frame, the name was a kind of trap in the end. Thus, if you already have long positions, then provide yourself insurance in the form of a Stop-Loss restrictive order, within the lower part of the accumulation. In turn, the position of the shifter is located below the accumulation of 1.2435, in case the TA pattern works, and we had a trap.
Based on the above information, we derive trading recommendations:
- The position for the purchase had prospects in the direction of 1.2550-1.2620, now the interest is double-digit, so secure the Stop-Loss deposit.
- We consider selling positions lower than 1.2435, with the prospect of a move of 1.2400-1.2350.
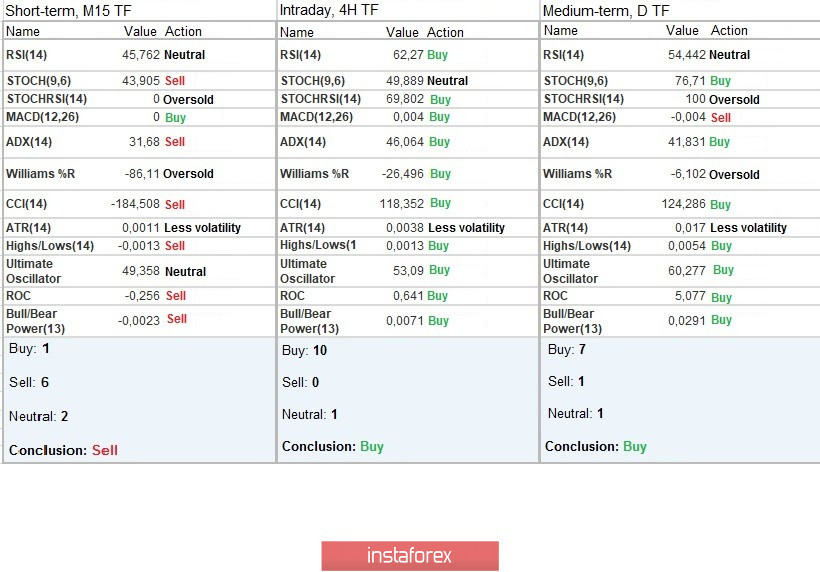
Indicator analysis
Analyzing a different sector of timeframes (TF), we see that due to the upward turn, the hour periods turned green, having a buy signal. Minute intervals work to restore relative to the morning impulse - a sell signal (variable). Daytime periods invariably have an upward signal due to inertia.
Volatility per week / Measurement of volatility: Month; Quarter Year
Measurement of volatility reflects the average daily fluctuation, calculated for Month / Quarter / Year.
(April 13 was built taking into account the time of publication of the article)
The volatility of the current time is 87 points, which is another 50% lower than the daily average. It is possible to assume that if speculative interest is maintained, along with Friday's accumulation, activity may still increase by 30-40%.
Key levels
Resistance Zones: 1.2500; 1.2620; 1.2725 *; 1.2770 **; 1.2885 *; 1.3000; 1.3170 **; 1.3300 **; 1.3600; 1.3850; 1.4000 ***; 1.4350 **.
Support areas: 1.2350 **; 1.2280 (1.2240); 1.2150 **; 1.2000 *** (1.1957); 1.1850; 1.1660; 1.1450 (1.1411); 1.1300; 1,1000; 1,0800; 1,0500; 1,0000.
* Periodic level
** Range Level
*** Psychological level
**** The article is built on the principle of conducting a transaction, with daily adjustment