From the point of view of complex analysis, we see local jumps of activity, but it has led to a new variable framework, and now let's talk about the details. The 38 hour stagnation of 1.0920 / 1.0950, which was set as early as last Friday, was still broken, but we only saw the so-called speculative traps and not the whole movement. So a surge of long positions was recorded in the first half of the day, which locally brought the quote to the area of 1.0967, but the speculators were not able to keep in the given course, and the breakdown turned out to be false. At this stage, short positions arise, which amid a false breakdown have a speed twice as high, which led not only to a breakdown of the boundary of 1.0920, but to a decline to the area of 1.0893. At this point, the trap closed, local acceleration subsided and everything returned to the framework of Friday's accumulation.
What remains after the local jumps?
The range of speculative activity is 1.0893/1.0967, which only changed the width of the stagnation amplitude, but not the general movement that many expected.
As for the theory of development, all local operations are still in priority without any changes. What you should pay attention to is the volatility, which shows a slowdown for the second week in a row relatively, in excess of the active period of March. That is, the dynamics is decreasing, but it is returning to normal before the panic of market participants, which means that adaptation to the external background is underway, and medium-term target movements may resume over time.
Details of volatility: Monday - 155 points; Tuesday - 183 points; Wednesday - 115 points; Thursday - 278 points; Friday - 166 points; Monday - 151 points; Tuesday - 234 points; Wednesday - 243 points; Thursday - 326 points; Friday - 194 points; Monday - 191 points; Tuesday - 160 points; Wednesday - 133 points; Thursday - 188 points; Friday - 194 points; Monday - 134 points; Tuesday - 127 points; Wednesday - 136 points; Thursday - 147 points; Friday - 91 points; Monday - 67 points; Tuesday - 142 points; Wednesday - 72 points; Thursday - 110 points; Friday - 33 points; Monday - 74 points. The average daily indicator, relative to the dynamics of volatility is 104 points [see table of volatility at the end of the article].
Analyzing the past trading day, we see two main turns actively, where the first one fell in the morning from 6:00 - 6:30 [UTC+00], while the second one which had a more detailed structure fell from 7:30-15:00 [UTC+00 time on the trading terminal].
As discussed in a previous review, traders viewed Friday's accumulation as a possible acceleration, where long positions were not entirely successful, but selling positions brought a small, but still income.
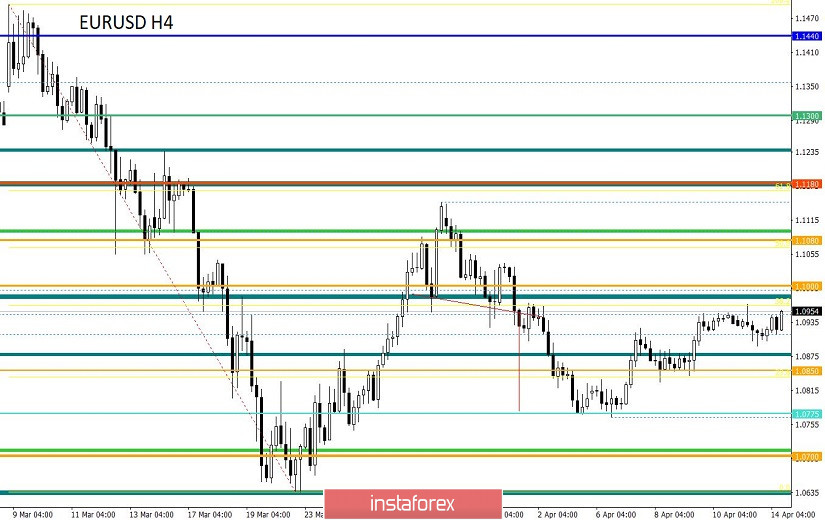
Considering the trading chart in general terms [the day period], we see a completely different picture, since there is not much of a slowdown, but what immediately catches the eye is the recovery relative to the inertia of 30.03.20-06.04.20. At this time, the rebound from the 1.0775 level was more than 190 points.
The news background of the past day did not have statistical data, and trading volumes were reduced due to the lack of Europeans on the market who celebrated Bright Monday.
In terms of the general informational background, we see that a strange shock from the coronavirus still persists among market participants, where not only catastrophic anti-records by the number of people infected in the world are actively discussed, but the consequences for the economy that have already manifested, or will appear in the very near future. Therefore, experts from JPMorgan predict that the COVID-19 virus will cost the world economy $ 5.5 trillion in the next two years. Thus, the current recession risks turning into the most acute peacetime recession since the 1930s. It is worth considering that although the recession will turn out to be local, it will take more than one year for the economy to recover at the pre-crisis level.
Breaking news has already been received today. French President Emmanuel Macron has extended the country's restrictive measures to counter the coronavirus for another four weeks, until May 11, and does not exclude the possibility of quarantine lasting even longer.
However, this news does not carry positive news. The single currency is losing its position.
Today, in terms of the economic calendar, we do not have any worthwhile statistics, but one of the advantages can be noted that Europeans returned from a two-day weekend, thus trading volumes stabilized.
Further development
Analyzing the current trading chart, we see that the price fluctuation is carried out within the past amplitude [1.0893 / 1.0967], but at the same time, not forgetting the framework of the Friday fluctuation 1.0920-1.0950. In fact, the theory of the new variable range is in some way confirmed and now the main question is, when do we expect acceleration? It is not so simple, the economic calendar is empty and the external background remains the same saturation as the day before. The technical component reflects lateral movement, but in the event of a breakdown of a certain boundary of 1.0893 / 1.0967, acceleration can theoretically occur.
It can be assumed that the fluctuation within the past range of 1.0893 / 1.0967 will hold back the quote temporarily, but it is best to build the work precisely on the breakdown of the set boundaries.
Based on the above information, we derive trading recommendations:
- We consider buying positions higher than 1.0970, with the prospect of a movement to 1.1000-1.1020
- We consider selling positions lower than 1.0890, with the prospect of a movement to 1.0850
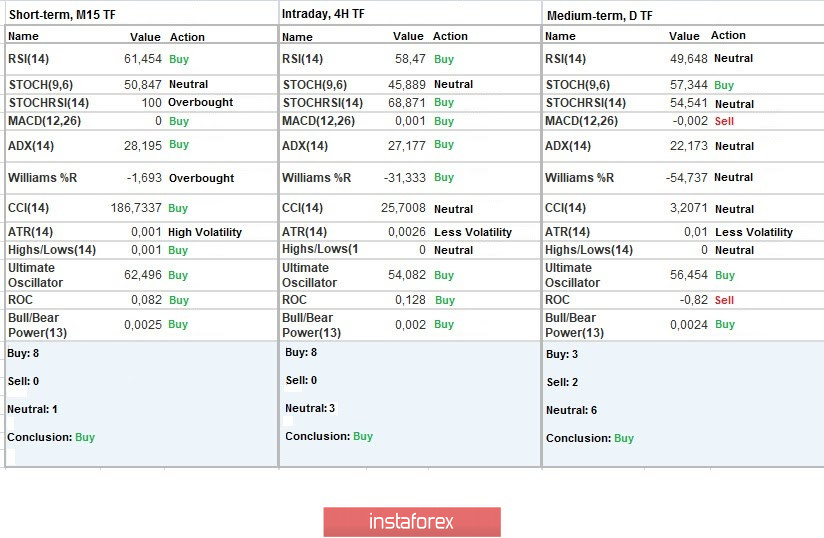
Indicator analysis
Analyzing a different sector of time frames (TF), we see that the indicators of technical instruments give a buy signal, but it should be taken into account that the minute and hour periods are under the pressure of lateral movement, hence the indicators are variable. The daily period also varies, but the purchase is neutral within the framework of the signals.
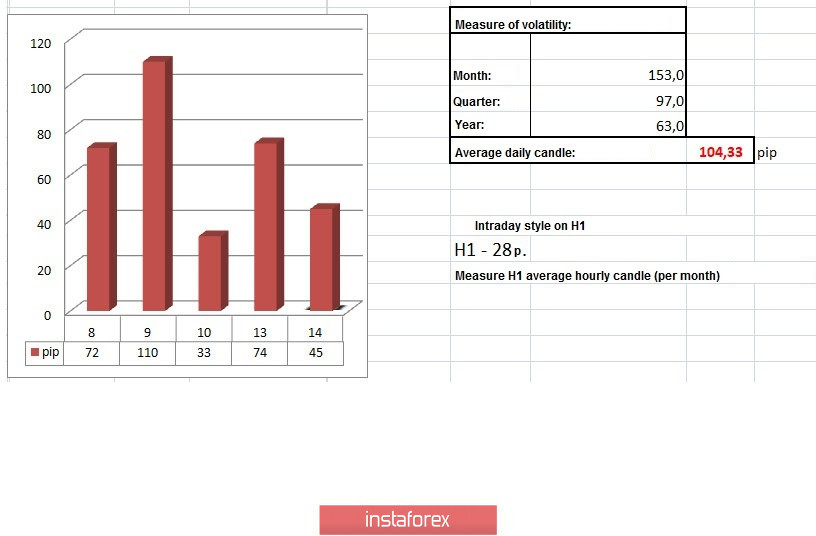
Volatility per week / Measurement of volatility: Month; Quarter; Year
Measurement of volatility reflects the average daily fluctuation calculated from Month / Quarter / Year.
(April 14 was built taking into account the time of publication of the article)
The volatility of the current time is 45 points, which is 56% lower than the daily average. It can be assumed that activity will still increase, but within the scope of the previous day.
Key levels
Resistance zones: 1,1000 ***; 1.1080 **; 1.1180; 1.1300; 1.1440; 1.1550; 1.1650 *; 1.1720 **; 1.1850 **; 1.2100
Support areas: 1.0850 **; 1.0775 *; 1.0650 (1.0636); 1.0500 ***; 1.0350 **; 1.0000 ***.
* Periodic level
** Range Level
*** Psychological level