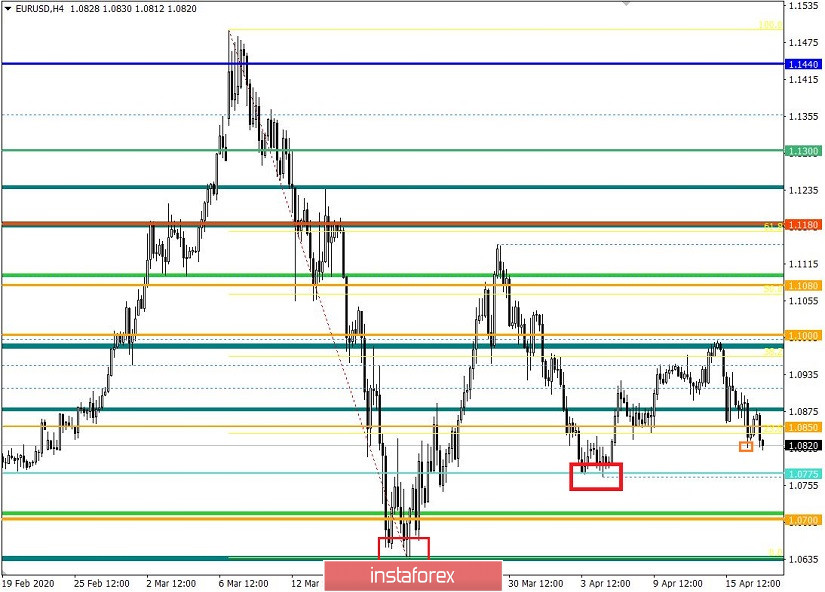
From a complex analysis perspective, we see a significant share of recovery relative to the previous measure. The end of the trading week and the development of more than 80% of the previous measure indicate that downward interest still takes place in the market, it is not in vain that we spend so much of our time considering short positions. Focusing the price below the 1.0850 level says a lot, and the most important thing is that a few points remain to the main support of 1.0775, which means that there is not much time left for possible acceleration.
Two days ago, we started discussing a new theory that reflects the consistent compression of quotes relative to inertial oscillations. So, the available beat of April 15 can become the main one in the compression structure, if in its development it is possible to break the boundary of the minimum of the previous inertia on 04/07 / 20-14 / 04, where the minimum reflects the level of interaction of trading forces 1.0775 (1.0764). In this case, the compression of the amplitude can lead to a reverse reaction, I mean acceleration, where subsequently the main point of support of the entire model as a minimum of 1.0636 will be called into question.
To avoid confusion and misunderstanding of the described theory, I advise you to read the previous article.
In terms of the volatility of the past day, we fix an indicator close to the daily average, which means that the mood of market participants is actively high. Do not forget that if we exclude panic from the general background, the activity of the euro / dollar pair will be approximately 65 points, which means that the current market activity is high for the single currency.
Details of volatility: Monday - 155 points; Tuesday - 183 points; Wednesday - 115 points; Thursday - 278 points; Friday - 166 points; Monday - 151 points; Tuesday - 234 points; Wednesday - 243 points; Thursday - 326 points; Friday - 194 points; Monday - 191 points; Tuesday - 160 points; Wednesday - 133 points; Thursday - 188 points; Friday - 194 points; Monday - 134 points; Tuesday - 127 points; Wednesday - 136 points; Thursday - 147 points; Friday - 91 points; Monday - 67 points; Tuesday - 142 points; Wednesday - 72 points; Thursday - 110 points; Friday - 33 points; Monday - 74 points; Tuesday - 84 points; Wednesday - 134 points; Thursday - 95 points. The average daily indicator, relative to the dynamics of volatility, is 102 points [see the table of volatility at the end of the article].
As discussed in the previous review, we considered the boundaries of 1.0850 / 1.0900 as points of variable interaction of trade forces, working on a breakdown. As a result, sales positions were opened.
Considering the trading chart in general terms, the daily period, you will see exactly the same inertial fluctuations, which the model compresses from period to period.
The news background of the past day contained data on industrial production in Europe, where the decline range from -1.7% to -1.9%. Seemingly, the data came out better as they were expecting a decline to at least -2.2%. However, this is only in February, it is expected that due to the turn of events in March everything will fall badly, thereby waiting and diversifying the risks.
In the afternoon, the published data on the labor market in the United States again showed a new record. At first glace, the figures for applications for unemployment benefits came out better than forecasts with initial applications of 5,245,000 and repeated applications of 11,976,000. However, their total number exceeded the mark of 22 million in four weeks. Against this background, you immediately recall the words of James Bullard, CEO of The Federal Reserve Bank of St. Louis, who talked about 30% unemployment in the second quarter.
As expected in the previous review, the market reaction to statistics was literally absent. It is in a panicky mood, and the principles of fundamental analysis that we know differ about what we have on the market.
In terms of the general information background, we have the annual spring meeting of the International Monetary Fund [IMF] and the World Bank, which this time was held in an online format. So, the highlight of the program was the head of the ECB Christine Lagarde, who said that the EU economy was facing a sharp drop in GDP and a rapid deterioration of the situation on the labor market in the midst of a raging coronavirus.
"Uncertainty is very high and will remain high, which makes it extremely difficult to predict the potential scale and duration of the inevitable recession, as well as the subsequent economic recovery," said the head of the ECB
Lagarde also added that the ECB supports the IMF measures taken in response to the COVID-19 virus, particularly the adaptation of credit programs and providing liquidity for countries with solid macroeconomic fundamentals.
Today, in terms of the economic calendar, as expected, inflation in the eurozone fell in March from 1.2% to 0.7%, which the market practically did not respond to. This fact about the reduction will not go unnoticed, since, with such statistical data, discussions on possible actions of the ECB regarding lowering the refinancing rate will again overwhelm market participants, giving a new panic mood.
The upcoming trading week in terms of the economic calendar is less saturated, but if you take into account such a moment that the market is now very exposed to the external background, this fact will not stop speculators.
Some most interesting events are shown below:
Tuesday, April 21
USA 14:00 UTC - Sales in the secondary housing market (Mar)
Thursday, April 23
EU 08:00 UTC - Composite index of business activity in the manufacturing sector Markit (April) PRELIMINARY
USA 12:30 UTC - Applications for unemployment benefits
USA 13:45 UTC - PMI Markit Index in the manufacturing sector (April) PRELIMINARY
USA 13:45 UTC - Markit services business activity index (Apr) PRELIMINARY
Friday, April 24th
USA 12:30 UTC - Orders for durable goods (Mar)
Further development
Analyzing the current trading chart, we see that the quotes focused on the minimum of the past day, where it has already managed to update it locally. In fact, this is a kind of signal that the downward mood is still preserved in the market, which may lead to a further descent to the area of the main support point of 1.0775. As we can see, local positions remain an actual trading strategy for the near future, but they can lead us to the main move, which many are so eagerly waiting for.
Parsing the time interval every minute, we see that the main turn of meek positions came again at the start of the European session.
With respect to the emotional component of the market, a high concentration of speculative positions is recorded.
It can be assumed that, if the mood is maintained, a further downward movement is not ruled out towards the level of 1.0755, where it is worthwhile to carefully monitor the consolidation points. This scenario will have the highest execution rate in case of consolidation lower than 1.0815, not a puncture shadow. Otherwise, the compression of the amplitudes based on the above theory may persist on the market.
Based on the above information, we derive trading recommendations:
- Consider buying positions higher than 1.0840, with the prospect of a move to 1.0860-1.0875.
- Consider selling positions in case of consolidation lower than 1.0815, with the prospect of a move to 1.0775.
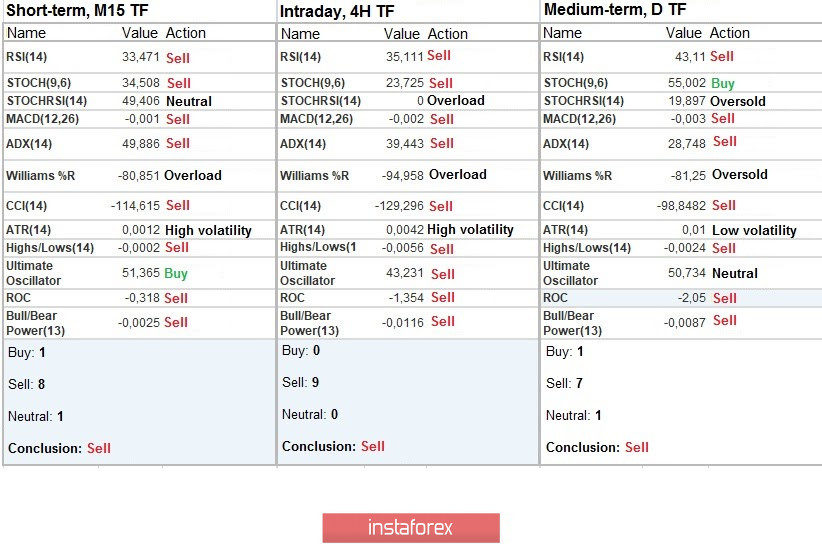
Indicator analysis
Analyzing a different sector of timeframes (TF), we see that the indicators of technical instruments relative to all the main time periods signal a downward interest due to the return of the price to the base point of the previous measure.
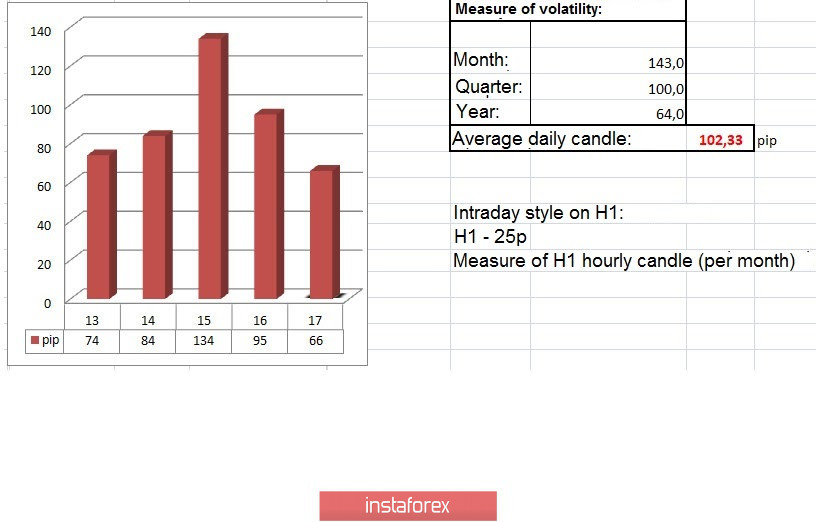
Volatility per week / Measurement of volatility: Month; Quarter Year
Volatility measurement reflects the average daily fluctuation calculated for the Month / Quarter / Year.
(April 17 was built taking into account the time of publication of the article)
The volatility of the current time is 66 points, which is 35% lower than the daily average. It can be assumed that if one has the mood and as a fact of the breakdown of the previous measure, acceleration can give + 30-45% to the current volatility.
Key levels
Resistance zones: 1.0850 **; 1,1000 ***; 1.1080 **; 1,1180; 1.1300; 1.1440; 1.1550; 1.1650 *; 1.1720 **; 1.1850 **; 1,2100
Support Areas: 1.0775 *; 1.0650 (1.0636); 1,0500 ***; 1.0350 **; 1,0000 ***.
* Periodic level
** Range Level
*** Psychological level