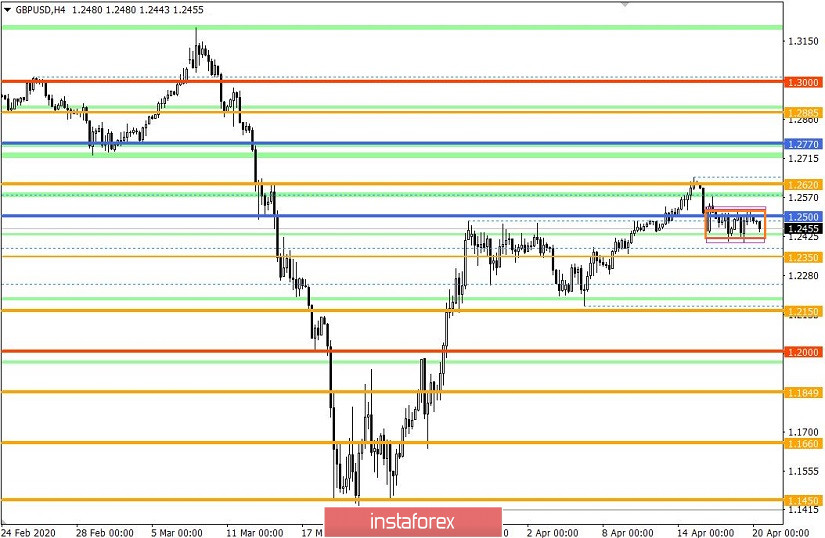
From the point of view of complex analysis, we see a downward mood, but it is still not on the scale that it could be. Now, let's talk about the details. The previous trading week had two phases at once, where the first in the structure of the ascending tact led the quote to the area of the resistance level of 1.2620, and the second phase had an attempt to form a reverse move. In fact, the second phase reflected a rebound from the 1.2620 level, but there is something more in its potential that so many are hoping for. In this case, we are talking about a more significant downward movement, during which the quote will not just rebound from the level of 1.2620, it will gradually move into the recovery process.
At this stage, the theory of downward development arises, where one should go through the steps of 1.2350 [#1] and 1.2150 [#2] to confirm it, only after that the majority will believe in the restoration theory. Otherwise, we will encounter a variable chatter, where the risk of resuming an upward beat will remain, with a 100% development of a V-shaped model as a result.
Do not forget that along with the theory, traders continue to work on local operations, as the existing activity, paired with the panic mood of the market, makes it possible to get quick income.
When analyzing Friday in detail, it is worth paying attention to the movement within 1.2405/1.2520, which almost simultaneously repeats the fluctuation on April 16. This is most clearly seen in the 30 minute period.
As discussed in the previous review, traders noticed the range of 1.2405/1.2520 in advance, where work was carried out on the breakdown of the established boundaries.
In terms of volatility, we see a mark above 100 points, which is already considered very good, but still below the daily average by 27%. It is worth noting that the average daily indicator is leveled, which signals adaptation.
Details of volatility: Monday - 165 points; Tuesday - 245 points; Wednesday - 172 points; Thursday - 358 points; Friday - 359 points; Monday - 144 points; Tuesday - 271 points; Wednesday - 676 points; Thursday - 354 points; Friday - 522 points; Monday - 267 points; Tuesday - 296 points; Wednesday - 333 points; Thursday - 452 points; Friday - 352 points; Monday - 148 points; Tuesday - 227 points; Wednesday - 108 points; Thursday - 126 points; Friday - 198 points; Monday - 116 points; Tuesday - 217 points; Wednesday - 131 points; Thursday - 122 points; Friday - 42 points; Monday - 87 points; Tuesday - 146 points; Wednesday - 193 points; Thursday - 119 points; Friday - 114 points. The average daily indicator, relative to the dynamics of volatility, is 158 points [see the table of volatility at the end of the article].
Considering the trading chart in general terms [the daily period], we see the fluctuation at the peak of the upward inertial course of March 20.
We did not have any worthwhile statistics on the UK and the United States for Friday's news background.
In terms of the general information background, we see the position of the British government's defense regarding attacks of untimely actions to protect the country from the COVID-19. As a result, the government published two separate refutations regarding a series of false accusations as well as the huge work done.
Refutations are, of course, good, but the facts of the crisis are even better, and so, in March, 51,498 companies stopped working in fraternization, while the creation of new organizations was reduced by a quarter.
This is only the small part, since the consequences of the pandemic are waiting for us ahead.
It is worth noting that there is already a government condemnation of the phased removal of restrictive measures to contain the coronavirus, where theoretically, schools can open on May 11, but I would like to repeat again, all this is still being discussed - nothing is unpleasant.
Today, in terms of the economic calendar, we do not have statistics for the UK and the United States, but the British Chancellor of the Treasury, Rishi Sunak, will launch a £ 1.25 billion company support package today.
Further development
Analyzing the current trading chart, we see another round of downward positions in the structure of the range between 1.2405 / 1.2520. In fact, the lateral movement and the work on the breakdown of the established boundaries is still relevant, which is what most traders are oriented to working both on local positions and on the main perspective.
In terms of the emotional mood of market participants, we see a gradual normalization of volatility, but the panic among market participants is still preserved.
It can be assumed that the fluctuation within the established limits of 1.2405 / 1.2520 will not last as long as many people think. The market is still subject to high activity, which means that a breakdown is not far and it is worth continuing to analyze break points.
Based on the above information, we derive trading recommendations:
- We consider buying positions higher than 1.2530 with the prospect of a movement to 1.2565-1.2620. The main movement is considered higher than 1.2650.
- We consider selling positions lower than 1.2400 with the prospect of a movement to 1.2350. The further move is considered after the price consolidates below 1.2340, with the prospect of a decline to 1.2285-1.2150.
As we can see, the recommendations remain the same as on Friday, as the market continues to focus within the established framework.
Indicator analysis
Analyzing a different sector of time frames (TF), we see that the indicators of technical instruments relative to minute and hour periods signal a sale due to the rebound process. Meanwhile, daily periods focus on the main course, giving a buy signal.
Volatility per week / Measurement of volatility: Month; Quarter; Year
Measurement of volatility reflects the average daily fluctuation, calculated for Month / Quarter / Year.
(April 20 was built taking into account the time of publication of the article)
The volatility of the current time is 58 points, which is another 63% lower than the daily average. It can be assumed that activity can still easily accelerate by 30-40%, but the acceleration can be 100-150% in case of breakdown of the established boundaries.
Key levels
Resistance Zones: 1.2500; 1.2620; 1.2725 *; 1.2770 **; 1.2885 *; 1.3000; 1.3170 **; 1.3300 **; 1.3600; 1.3850; 1.4000 ***; 1.4350 **.
Support areas: 1.2350 **; 1.2280 (1.2240); 1.2150 **; 1.2000 *** (1.1957); 1.1850; 1.1660; 1.1450 (1.1411); 1.1300; 1.1000; 1.0800; 1.0500; 1.0000.
* Periodic level
** Range Level
*** Psychological level
**** The article is built on the principle of conducting a transaction, with daily adjustment