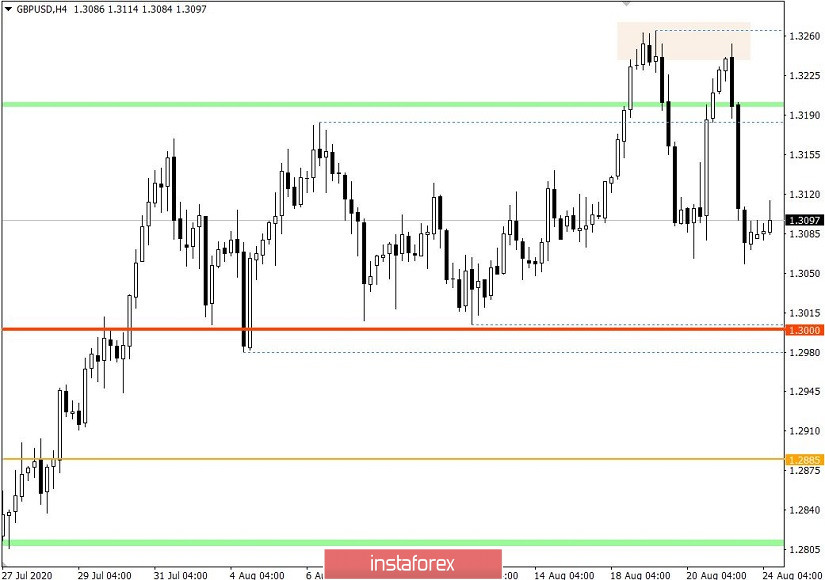
The last trading week passed on a wave of unusual fluctuations, where at first, there was a sharp slowdown, and then a four-day rally of patterns in the form of V-shaped patterns. The upper border of the sideways channel 1.3000/1.3185 was locally broken by the price, but no significant changes followed, the quote continued to move at the previous levels.
Such high activity and lack of a clear direction can speak of one thing, market participants are in a stage of ambiguity, which is confirmed by a number of technical and fundamental factors.
The high degree of overbought of the pound sterling and the oversold of the US dollar puts pressure on market participants, which leads to chaotic price fluctuations. In turn, the difficult situation in the economy of the United Kingdom and the rapidly growing value of the pound sterling put traders into a trance, which activates speculative interest, which, regardless of technical and fundamental analysis, uses the current market situation to its advantage.
Based on the high dynamics and characteristic ambiguity in further actions, the method of local operations remains the best trading tactic.
Analyzing M30 TF, a round of short positions that arose from 6:30 and lasted until 14:30 UTC+00 was seen during last Friday's trading. The movement had the appearance of inertia and completely repeated the swing of August 19. The reverse V-shape is considered complete.
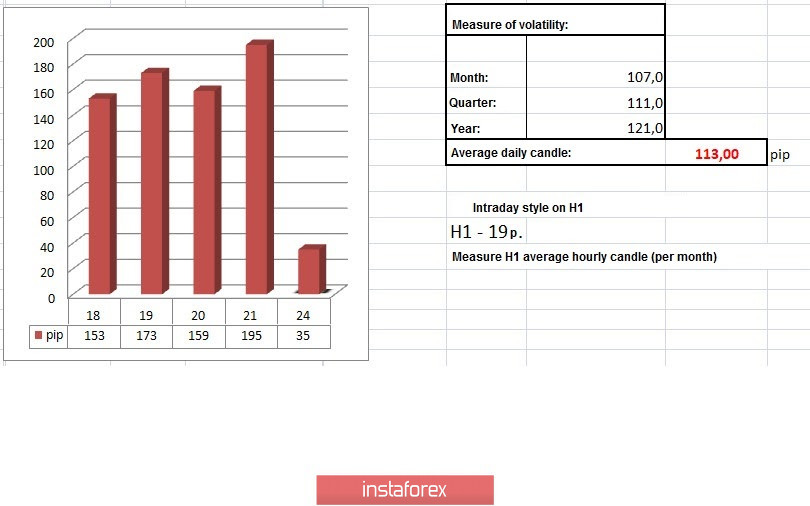
In terms of daily dynamics, aggressive activity is recorded for four days in a row: 153 ---> 173 ---> 159 ---> 195. Friday's indicator is considered the highest in 80 trading days. It is 72% higher than average level.
The coefficient of speculative operations is literally off the scale, whether this will be considered a signal of upcoming changes in the market.
As discussed in the previous review, traders viewed price fluctuations within a local high as a signal for an acceleration that occurred in the market over time.
The August 21st recommendation for short positions matched where traders could earn even more expectations.
[We consider sell positions in the case of price consolidation below the level of 1.3215, with the prospect of a move to the level of 1.3185-1.3150.]
Looking at the trading chart in general terms (daily period), you can see the price movement within the boundaries of the previously indicated stagnation, where only 35 points did not reach the reference level - 1.3300.
The news background on Friday included data on retail sales in Britain, which rose 3.6% in July, sales increased by 1.4% in annual terms.
The market did not react at the time of publication, possibly due to the overbought pound sterling.
Preliminary data on business activity in Britain will be released before afternoon, where the service sector grew from 56.5 to 60.1, and the manufacturing sector will change from 53.3 to 55.3.
The indicators were ahead of expectations, but the market did not appreciate it, and the overbought pound sterling entered the stage of decline.
On the second day, similar PMI indicators were published, but for the United States, where the service sector accelerated from 50.0 to 54.8, and the manufacturing sector will change from 50.9 to 53.6. In the US, they will also publish indicators on sales in the secondary housing market for July, where they recorded an increase of 24.7% instead of 14.7%
The market reaction to the US statistics was on the general flow of the dollar strengthening.
In terms of the information background, we have another round of negotiations between England and Brussels on the Brexit deal, where during a press conference, the Chief negotiator from the EU, Michel Barnier, doubted the conclusion of an agreement between the countries.
"In general, it is unlikely that the EU and the UK will be able to conclude an agreement before the end of the year. I do not understand why we continue to waste time on these negotiations with such an attitude of the British side, "- Michel Barnier.
The 7th round of negotiations ended on Friday, August 21. The 8th round is scheduled for September 7 and will last until September 11.
Today, in terms of the economic calendar, we do not have any significant statistical data. The market will continue to work on speculative interest, as it was last week.
Further development
Analyzing the current trading chart, you can see that after Friday's rally, the market moves within a narrow range of 1.3058/1.3115, which may become a platform for new leaps.
In this situation, it can be assumed that the accumulation process within 1.3058/1.3115 will not last long, the best tactic in case of high speculation is the method of price breaking out of stagnation, which will lead to local jumps in the market.
Based on the above information, we will display trading recommendations:
- Consider buy deals above the level of 1.3125, with the prospect of a move to the level of 1.3200-1.3240.
- Consider sell deals below the level of 1.3055, with the prospect of a move to the level of 1.2985 / 1.3000.
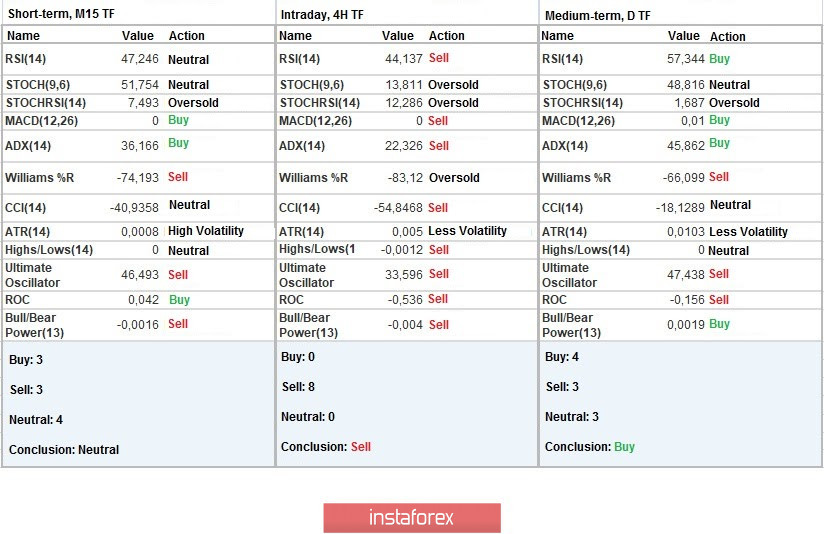
Indicator analysis
Analyzing different sectors of time frames (TF), we see that the indicators of technical instruments on minute intervals have a neutral signal due to price fluctuations in a narrow range. Meanwhile, hourly periods signal a sell through Friday's rally, while the daily period has a buy signal reflecting the general direction.
Weekly volatility / Volatility measurement: Month; Quarter; Year
Measurement of volatility reflects the average daily fluctuation, calculated per Month / Quarter / Year.
(August 24 was built taking into account the time of publication of the article)
The volatility of the current time is 35 points, which is 69% below the daily average. An increase in activity will occur at the moment of breakdown of one or another stagnation boundary.
Key levels
Resistance zones: 1.3200; 1.3300 **; 1.3600; 1.3850; 1.4000 ***; 1.4350 **.
Support zones: 1.3000 ***; 1.2885 *; 1.2770 **; 1.2620; 1.2500; 1.2350 **; 1.2250; 1.2150 **; 1.2000 *** (1.1957); 1.1850; 1.1660; 1.1450 (1.1411); 1.1300; 1.1000; 1.0800; 1.0500; 1.0000.
* Periodic level
** Range level
*** Psychological level