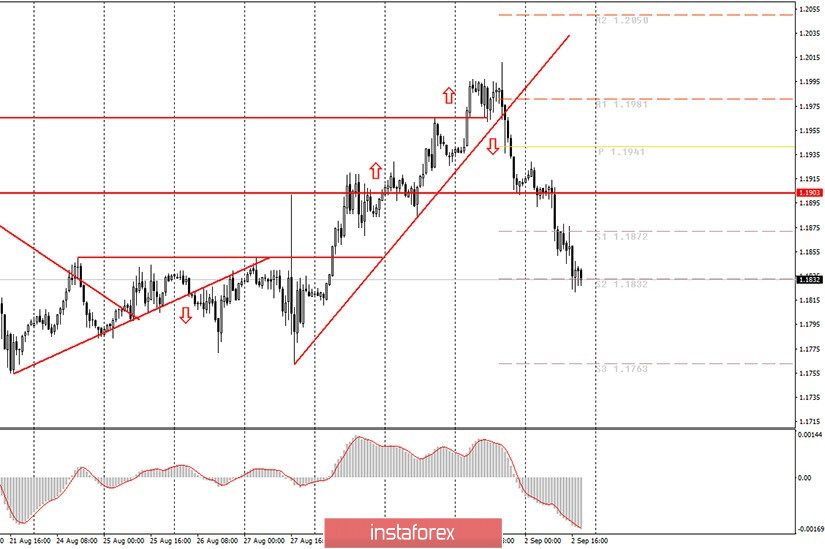
Hourly chart of the EUR/USD pair
On Wednesday, September 2, the EUR/USD pair simply continued to move down without any correction or a hint of its beginning. Even the MACD indicator did not turn up and, thus, did not form a signal to close short positions. As a result, the first target level of 1.1872 was reached and overcome, and then the second support level 1.1832 was also reached. Thus, traders who have remained in the market since the price has settled below the upward trend line are currently in profit of about 120 points. Those traders who opened new trades this morning are in profits of 35 to 70 points. We believe it is possible to close sell orders around the 1.1832 level, although the quotes could continue to fall. The MACD indicator may start to discharge in the near future. An indicator discharge is when the histogram's movement and signal line are in a different direction than the price movement. That is, for example, the indicator began to rise, but the price continues to fall. This happens when the pair moves in one direction for too long and without corrections. The indicator has a limited one-way stroke, so it simply cannot go down infinitely and starts to discharge. Therefore, if the indicator reverses, but the price does not, this signal is considered false and invalid. So, if the price correction does not start by tonight and tomorrow morning, the indicator will most likely start to discharge.
The most important event for today is the ADP report on changes in the number of employees in the US private sector. This is a very remarkable moment. As we have already figured out, the dollar continues to consecutively grow for days, and yesterday, we concluded that the ISM index and weak eurozone inflation contributed to its appreciation. Today the ADP report turned out to be below the forecasted values, and significantly lower. Accordingly, it could not provide support to the US dollar. Accordingly, the dollar continued to rise solely for technical reasons. And the technical reasons could be: 1) buyers closing long positions, which leads to an increase in the euro's supply in the market and a fall in its rate; 2) sellers opening short positions, which leads to a decrease in the dollar's supply in the market and a fall in the pair's rate.
The European Union is set to release the following data on September 3: the index of business activity in the services sector and retail sales for July. The United States will publish applications for unemployment benefits, trade balance, ISM and Markit PMIs for services. We believe that from this entire list of macroeconomic reports, one can pay attention only to the ISM index for the service sector in the United States. European news is likely to be ignored. American ones can also be ignored, so you should pay more attention to technical factors.
Possible scenarios for September 3:
1) Novice traders are not recommended to buy at this time, since the pair has already settled below the upward trend line, so the trend has now changed to a downward trend. There are currently no signals or technical patterns that support the upward trend. Thus, buyers only need to wait for the formation of trend lines or channels that would indicate an upward trend.
2) Sales continue to look more relevant, but after a two-day drop in quotes, an upward correction is already brewing. If the price fails to overcome the 1.1832 level, the upward movement could start from here. Therefore, we recommend reducing short positions near the 1.1832 level, and considering options for opening new sales after the pair corrects to the upside.
On the chart:
Support and Resistance Levels are the Levels that serve as targets when buying or selling the pair. You can place Take Profit near these levels.
Red lines are the channels or trend lines that display the current trend and show in which direction it is better to trade now.
Up/down arrows show where you should sell or buy after reaching or breaking through particular levels.
The MACD indicator consists of a histogram and a signal line. When they cross, this is a signal to enter the market. It is recommended to use this indicator in combination with trend lines (channels and trend lines).
Important announcements and economic reports that you can always find in the news calendar can seriously influence the trajectory of a currency pair. Therefore, at the time of their release, we recommended trading as carefully as possible or exit the market in order to avoid a sharp price reversal.
Beginners on Forex should remember that not every single trade has to be profitable. The development of a clear strategy and money management are the key to success in trading over a long period of time.