At last week's trading, there was a serious collapse of the British pound, which is partly due to the unresolved problem of concluding a trade deal between the UK and the European Union. At the same time, we cannot say that the macroeconomic data coming from the Foggy Albion is disappointing. However, the focus of market participants again turned out to be Brexit, which still can not be completed.
Before proceeding to the price charts of the GBP/USD currency pair, I will note the main events that will undoubtedly have a strong impact on the price dynamics of this instrument. Naturally, these are the decisions on the rates of the Central Banks of the two countries and the subsequent comments of their leaders. On Wednesday, at 19:00 (London time), the results of the two-day Fed meeting will be announced and updated economic forecasts will be published. Half an hour later, Fed Chairman Jerome Powell will hold a press conference. The next day, the baton will be picked up by the Bank of England, which will announce its decision on interest rates at 12:00 (London time), and also publish the minutes of the meeting. However, this week, there will be a lot of important macroeconomic statistics. I recommend that traders of the British pound pay attention to the data on the UK labor market, as well as the consumer price index for August. All details in the economic calendar. Now let's move on to the technical analysis of GBP/USD and analysis of charts.
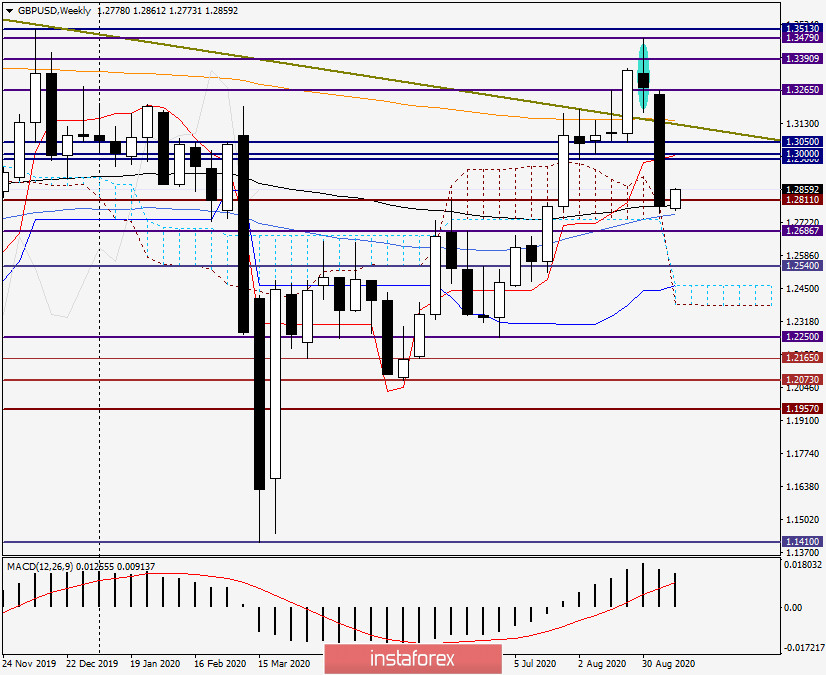
Weekly
As already noted at the beginning of the article, the British pound showed a very strong downward trend at the trading on September 7-11. In contrast to the euro/dollar for this currency pair, the market has seriously taken up the development of a dedicated reversal candle model. As a result of the fall, the pair returned to the long-term resistance line 1.5817-1.3184, breaking through the 200 exponential moving average, which is colored orange on the chart. However, this is not all. As you can see, after a further decline, the pair fell below two very significant levels of 1.3050 and 1.3000. As a result, the last five-day trading ended at 1.2791. It's been a long time since we've seen a Briton crash like this. But taking advantage of its speculative nature and increased volatility, the sterling can take off like a rocket and fall like a brick, as it demonstrated last week. I wonder if this is the end of the pound's troubles.
Last week, the pair's decline was stopped by the new exponential moving average, and today's trading shows an increase in GBP/USD, which is likely to be corrective. However, as already noted, the main impact on the course of trading on GBP/USD will be the results of the meetings of the Fed and the Bank of England, which means that you need to take into account both scenarios and consider options for positioning in both directions.
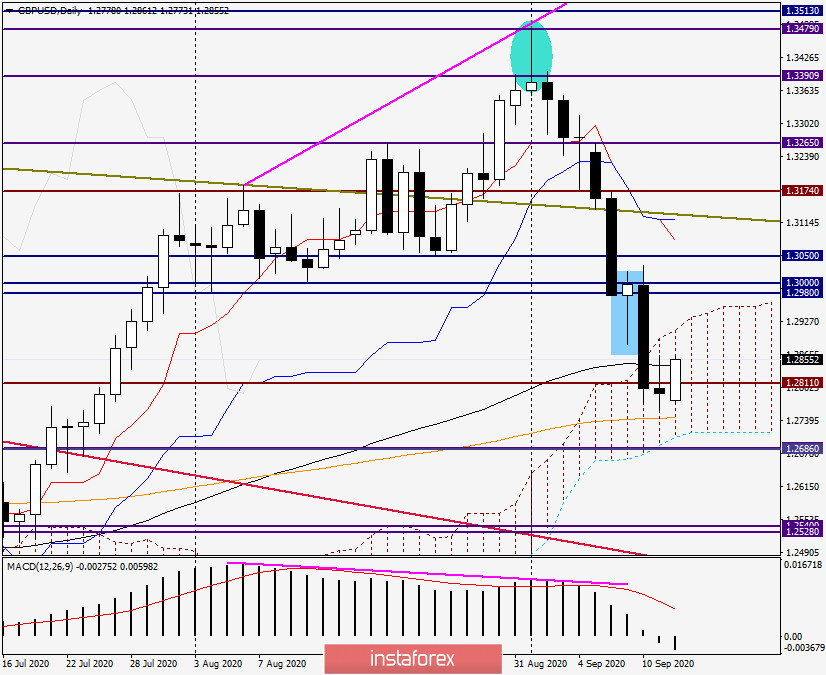
Daily
Despite the bullish reversal candle highlighted by the rectangle, the market completely ignored this bullish signal and continued its heavy movement in the south direction. On this chart, the 89th EMA (black) failed to contain the sellers' pressure and was broken through. Moreover, the price went within the limits of the Ichimoku cloud and was fixed in it. At the end of the review, a pullback occurred to the broken 89 EMA, which can be used to open short positions. Although I do not recommend entering the market based on the daily timeframe, there are smaller time intervals for this, which can be used to calculate a more accurate entry into the market. A corrective pullback is indicated by Friday's doji candle, which has become a technical factor for today's growth.
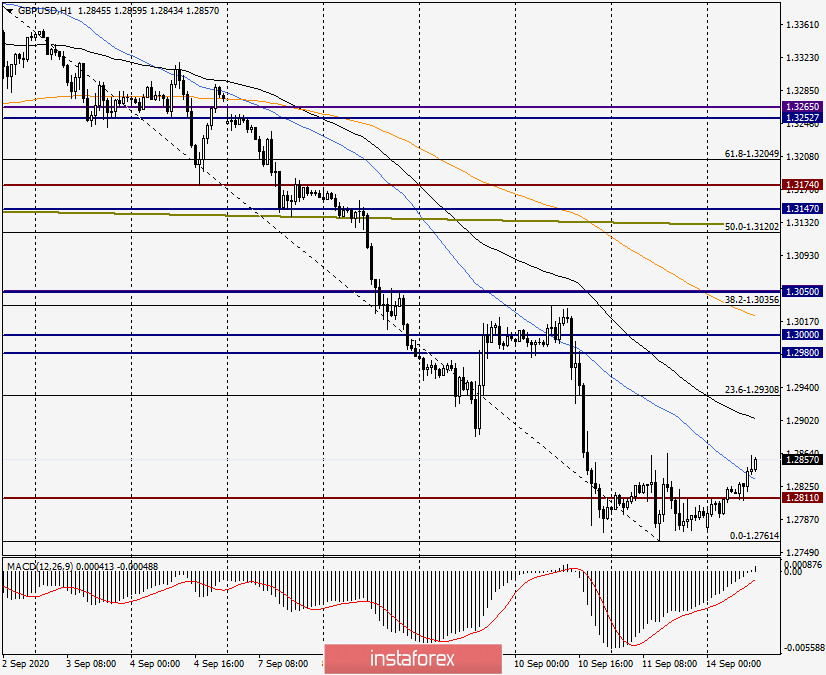
H1
In my personal opinion, the most suitable timeframe for entering the market is the hourly chart. Stretched the Fibonacci grid to the fall of 1.3479-1.2761. As you can see, the pound/dollar is in a strong downward trend, which has every chance of continuing. Given this factor, I recommend looking for points to open sales for GBP/USD after corrective pullbacks. I do not think that the adjustment will be significant, although the meetings of both Central Banks may make it so. If you look at the purely technical nuances for opening short positions on GBP/USD, I like the price zone of 1.2900-1.2930. If the pair can go up there, I recommend that you look closely at the opening of sales, especially if the selected zone will have reversal patterns of candle analysis on the four-hour and (or) hourly charts.