What is needed to open long deals on EUR/USD
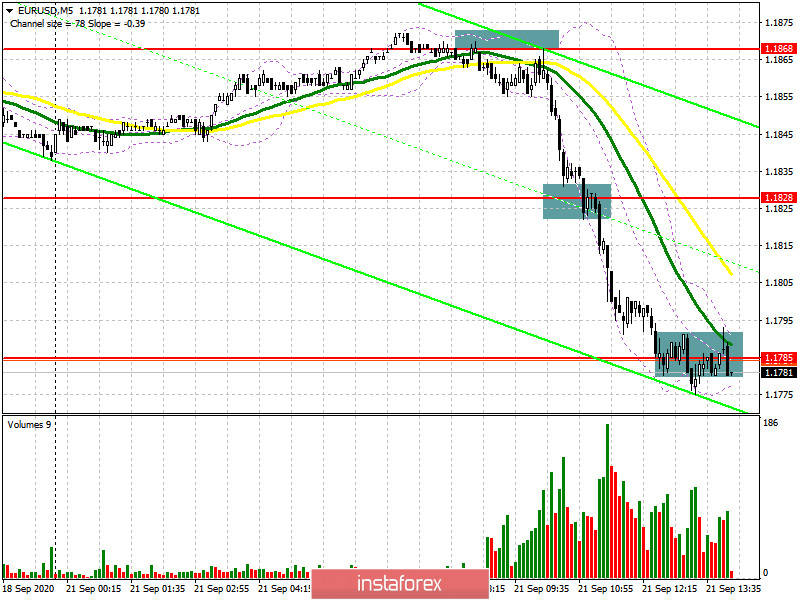
A good entry point for short positions in the first half of the trading day enabled traders to make nice profits amid a decline of the single European currency. Let's look at the 5-minute chart to figure out where we could and should have entered the market. In the morning analysis, I recommended opening short deals after a fake breakout is formed at 1.1868. This actually happened. A failed attempt of the bulls to climb above this level and its second test downwards created a good point for opening short positions. That pushed the price to the low of 1.1828. Later, the pair tested the major support of 1.1785 where the decline was stalled.
The bulls seem to be in no hurry to return to the market. The bulls are especially discouraged by the news that Germany is re-introducing restrictive measures against COVID-19. As the cold season is around the corner and the second coronavirus wave is imminent, the authorities are going to set facilities around the country where people with symptoms can apply for urgent medical help. Another reason to dampen the risk-on mood is the resignation of the Czech healthcare minister and his statements. He spoke about unexpected twists of the coronavirus situation.
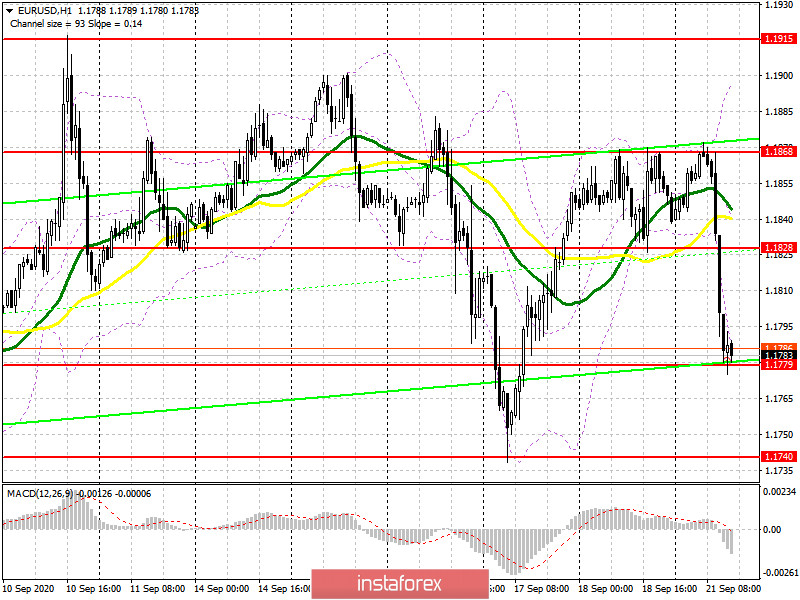
From the technical viewpoint, buyers have to protect support of 1.1779. A fake breakout of that level is expected in the second half of the day after leaders of Federal Reserve Banks deliver their remarks. So, this fake breakout will signal that the time is ripe to open long positions, bearing in mind a bounce and new resistance following 1.1828 where I recommend profit taking. A more distant target is seen as the high of 1.1868. If EUR comes under pressure again, that is likely to happen, it would be better to cancel long positions until the low of the month is tested at 1.1740, bearing in mind a 20-30 pips move intraday.
What is needed to open short deals on EUR/USD
A surprise decline of EUR enabled the pair to reach lower support following 1.1785 where the bulls gave up and shifted the trading range to 1.1779. Now the bears' aim is to break and hold the price below that level. This will increase pressure on EUR and trigger a new bearish wave to the lowest point of the month at 1.1740 where I recommend profit taking. More distant targets are still seen at 1.1714 and 1.1648. They will be hit on condition of unexpected remarks from leaders of the Federal Reserve Banks or the ECB officials.
If an upward correction is unfolding in the second half of the trading day amid the lack of fundamental data, it would be better not to rush opening short deals. Please wait until the price forms new resistance after 1.1828 with a fake breakout there. It would be a good idea to open short positions from the high of 1.1868 on a rally, bearing in mind a 20-30 pips correction intraday.
Signals of technical indicators
Moving averages
The pair is trading below 30- and 50-period moving averages which are now serving as an extra resistance level for EUR buyers.
Remark. The author is analyzing a period and prices of moving averages on the 1-hour chart. So, it differs from the common definition of classic daily moving averages on the daily chart.
Bollinger Bands
EUR growth will be capped by the upper level of the indicator at near 1.1835. In case EUR declines, the lower border of the indicator at near 1.1755 will act as support.
Definitions of technical indicators
- Moving average recognizes an ongoing trend through leveling out volatility and market noise. A 50-period moving average is plotted yellow on the chart.
- Moving average identifies an ongoing trend through leveling out volatility and market noise. A 30-period moving average is displayed as the green line.
- MACD indicator represents a relationship between two moving averages that is a ratio of Moving Average Convergence/Divergence. The MACD is calculated by subtracting the 26-period Exponential Moving Average (EMA) from the 12-period EMA. A 9-day EMA of the MACD called the "signal line".
- Bollinger Bands is a momentum indicator. The upper and lower bands are typically 2 standard deviations +/- from a 20-day simple moving average.
- Non-commercial traders - speculators such as retail traders, hedge funds and large institutions who use the futures market for speculative purposes and meet certain requirements.
- Non-commercial long positions represent the total long open position of non-commercial traders.
- Non-commercial short positions represent the total short open position of non-commercial traders.
- The overall non-commercial net position is the difference between short and long positions of non-commercial traders.