The GBP/USD pair has been moving in a variable range of 1.2674/1.2800 for three days, after the price consolidated at the new levels below 1.2770. The structural change of the price movement is in full swing, where consolidating the price at new levels allows sellers to regroup trading positions before the main movement.
The price subsequent development implies a further weakening of the pound, with a return to the area of spring this year. The theory consists of a number of technical and fundamental factors that create the foundation of justifications for sellers. If we consider the fundamental point of view, we are talking about the economic risk associated with Brexit and COVID-19; however, the technical side speaks about the high value of the pound, which is not due to the current situation.
Therefore, even if a correction occurs in relation to the existing stagnation, this will not affect the medium-term outlook, since its process has already been set in the market.
Analyzing Friday's fifteen-minute TF, you can see a round of short positions, which arose from 7:30 and lasted until 11:00 UTC+00, during which the quote approached the local low on Thursday, where it slowed down and reversed.
In terms of daily dynamics, an acceleration is recorded relative to the last two days, but in terms of the average level of volatility, a slowdown of 6% is visible. It should be noted that the indicator of daily activity above 100 points can no longer be considered a slowdown, even when working with this currency pair.
As discussed in the previous analytical review, market participants will be inclined towards a downward development in the near future. That is, a temporary fluctuation in a variable range or even a correction is not ruled out in the current stage.
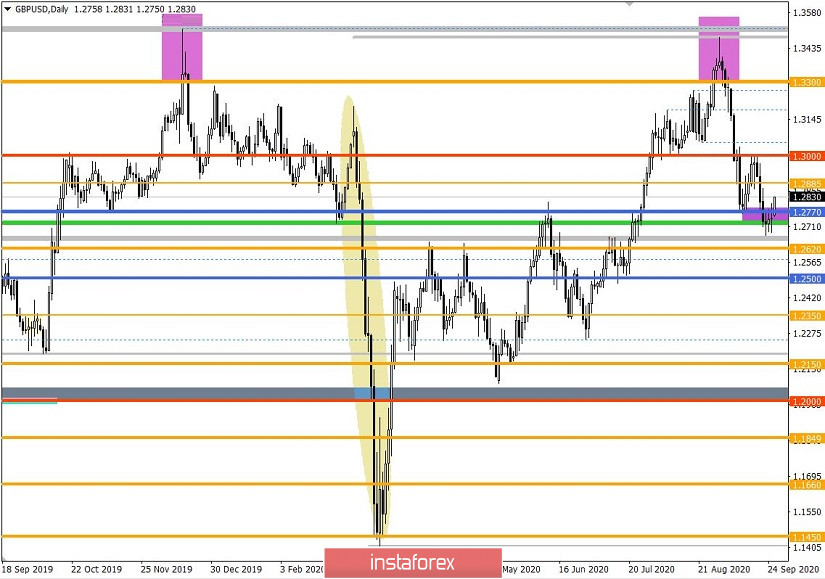
Considering the trading chart in general terms (daily period), we can see a price change of more than 800 points, which is considered a significant move, but even with it, the pound still has a margin for decline.
Last Friday's news background contained US data on orders for durable goods in August, where they only grew by 0.4% against the forecast of 1.5%.
In terms of information background, London called on Brussels to abandon unrealistic ambitions for the sake of a Brexit deal.
David Frost and Michel Barnier met several times before the ninth round of negotiations, where the final details of the deal were discussed and according to Frost, there was progress.
He said that concluding the agreement is still very possible, but at the same time, it is not guaranteed. The last two weeks of informal negotiations have been relatively positive, but there is a lot to be done given the short period of time.
The British negotiator hopes Brussels will show flexibility during the ninth round and begin working on a more realistic position that will suit everyone.
In terms of the economic calendar, we do not have significant statistics for the UK and US. Thus, we will focus on the information flow related to Brexit and COVID-19.
Further development
Analyzing the current trading chart, you can see that the quote has moved closer to the local high (1.2803) of September 25, which in theory, can lead to a structural change of the variable flat to a corrective move, if the price is consolidated above this value.
It is worth noting that in the current situation, the correction course will not violate the integrity of the downward development, thus the prospect of a decline towards the levels of this spring is still possible in the market in the medium term.
Local operations are possible based on the current quote location:
- Consider buy deals above 1.2815, towards 1.2865.
- Consider sell deals below 1.2760, towards 1.2700.
Indicator analysis
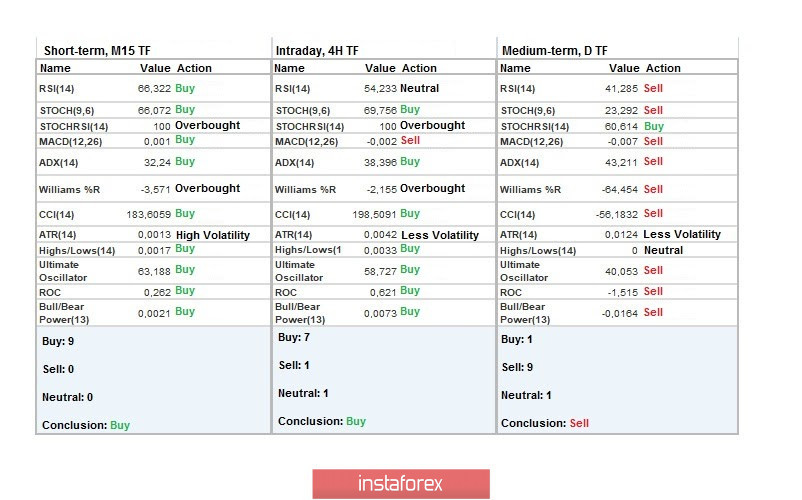
Analyzing different sectors of time frames (TF), we see that the indicators of technical instruments on the minute and hourly TFs signal a buy due to a local surge in long positions. In turn, the daily TF signals a sale, focusing on updating local lows.
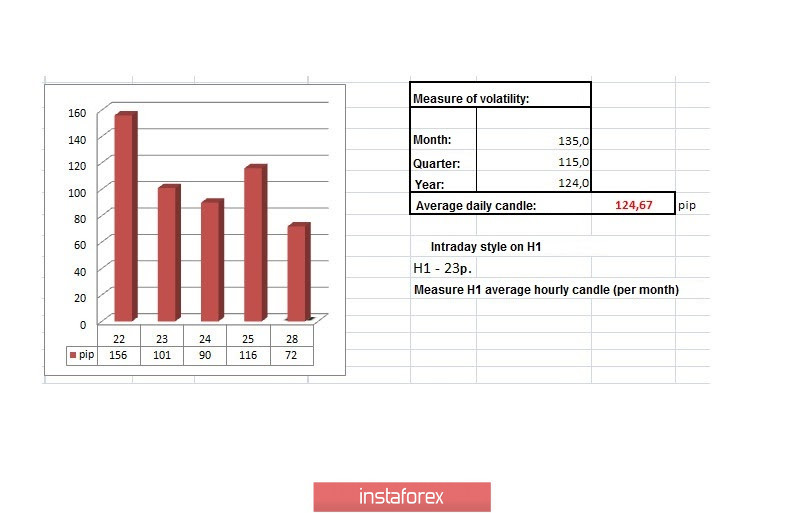
Weekly volatility / Volatility measurement: Month; Quarter; Year
The volatility measurement reflects the average daily fluctuations, calculated per Month / Quarter / Year.
(It was built considering the publication time of the article)
The volatility of the current time is 72 points, which is 42% below the average. We can assume that speculative excitement will continue to increase activity in the market.
Key levels
Resistance zones: 1.2885 *; 1.3000 ***; 1.3200; 1.3300 **; 1.3600; 1.3850; 1.4000 ***; 1.4350 **.
Support zones: 1.2770 **; 1.2620; 1.2500; 1.2350 **; 1.2250; 1.2150 **; 1.2000 *** (1.1957); 1.1850; 1.1660; 1.1450 (1.1411).
* Periodic level
** Range level
*** Psychological level