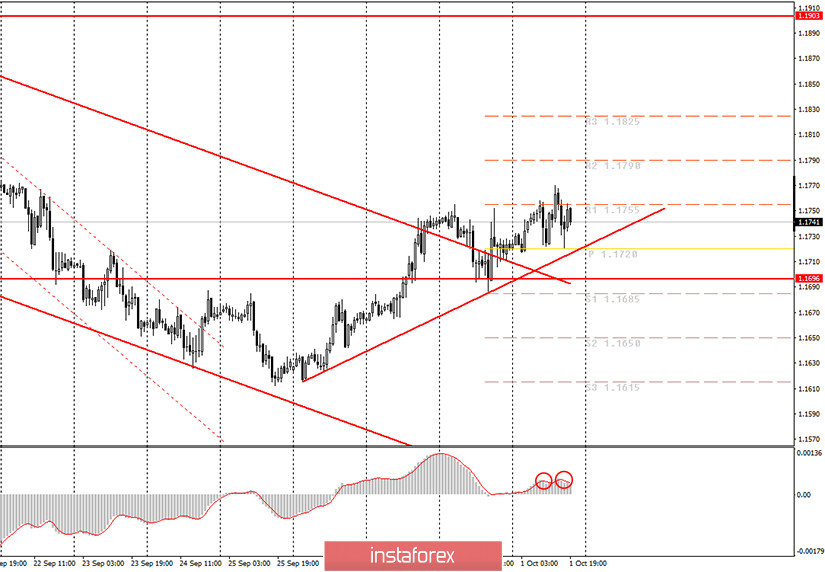
EUR/USD hourly chart
On Thursday, October 1, the EUR/USD pair was again showing mixed dynamics which could be difficult to analyze, especially for novice traders. When the price consolidated above the descending channel, the uptrend began. It is now supported by an ascending trendline. We also mentioned that the pair has not actually finished the correction phase after a 120-pips rally on September 28-30. Thus, the trendline displays a steep slope which means that almost any correction can lead to the price settling below it. Today, trading has been even more difficult than before. During the session, the price changed its direction several times, while the MACD indicator turned twice to the downside. Therefore, there were no good signals for opening short positions during the day. In the morning, we also advised you not to rush with placing buy orders, and, as it turned out, we were right. Novice traders can follow a bullish trend using other indicators and trading systems. However, we recommend doing this with extreme caution.
On Thursday, there was almost no important news for the EUR/USD pair. Basically, we could tell this based on the pair's trajectory during the day. It is also worth noting that since the beginning of the coronavirus pandemic, markets began to downplay macroeconomic statistics which is actually not so common. For instance, traders expectedly have not reacted to the PMI data from Germany, the EU, and the US. However, we should mention that the changes in these indicators were minor and none of them went below the mark of 50.0, which would mean bad news for the economy. The unemployment rate in the EU rose by 0.2%, but this data also did not impress market participants.
On Friday, October 2, the European Union is scheduled to publish the inflation data for September. The inflation rate is expected to reach -0.2% year-on-year. This report is rather important. However, even this release can be ignored by market participants. A real change in investor sentiment may happen later in the day when the NonFarm Payrolls report is published in the US. This report shows how many new jobs have been created in the country outside the agricultural sector. This data is considered extremely important and best reflects the state of the labor market in the country. Analysts expect that 850 thousand new jobs have been created. If this indicator is exceeded by 100 thousand or more, this may cause a rise in the US currency and, therefore, a drop in the euro/dollar pair. In addition, Vice President of the ECB Luis de Guindos will deliver a speech on Friday, which can possibly encourage the markets. Besides, the US will publish the data on unemployment rate in the country.
Possible scenarios for October 2
1) As the ascending line is still in place, long positions remain relevant. However, we mentioned several times that the pair needs to complete correction. Therefore, we recommend being extremely careful when opening buy deals on the euro. Otherwise, you should refrain from trading at this time. The problem is that at any moment the price can settle below the trendline, and change its direction several times during the day. The upward targets are found at the levels of 1.1790 and 1.1825.
2) Selling the pair is not relevant at the moment. The technical picture confirms the continuation of the upward movement. To open sell positions, you need to wait until the price settles below the ascending trendline. Even in this case, it may be a false signal which just shows the beginning of correction. To sum up, the current situation is quite difficult for novice traders.
On the chart
Support and Resistance Levels are the Levels that serve as targets when buying or selling the pair. You can place Take Profit near these levels.
Red lines are the channels or trendlines that display the current trend and show in which direction it is better to trade now.
Up/down arrows show where you should sell or buy after reaching or breaking through particular levels.
The MACD indicator (14, 22, and 3) consists of a histogram and a signal line. When they cross, this is a signal to enter the market. It is recommended to use this indicator in combination with trend patterns (channels and trendlines).
Important announcements and economic reports that you can always find on the economic calendar can seriously influence the trajectory of a currency pair. Therefore, at the time of their release, we recommend trading as carefully as possible or exit the market in order to avoid sharp price fluctuations.
Beginners on Forex should remember that not every single trade has to be profitable. The development of a clear strategy and money management are the key to success in trading over a long period of time.