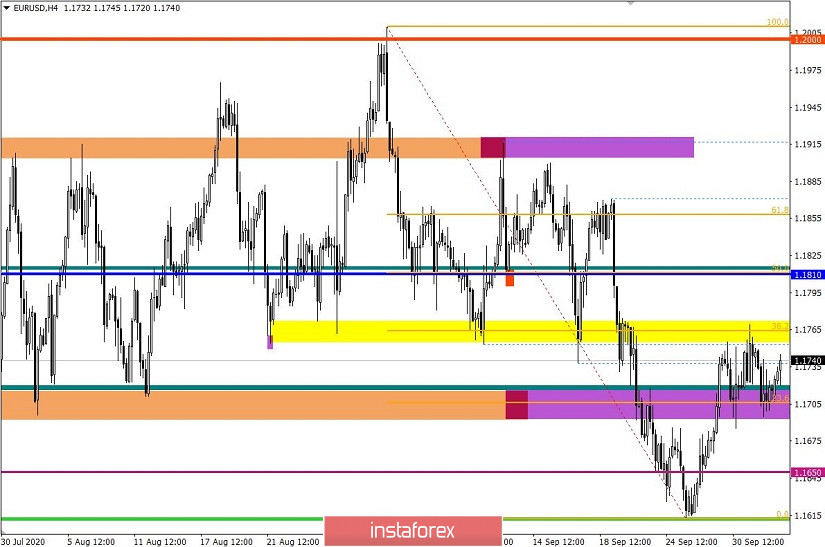
The EUR/USD pair is moving along a correction course from the local low of 1.1612, where a stagnation was formed in the variable range 1.1700/1.1770 from the period of September 30 - October 2. In fact, there is a kind of accumulation in the market, where the range boundaries can serve as a platform for completing a corrective move. This scenario would be a logical continuation of the downward trend of the past month.
In terms of graphical analysis, traders identified a defective "Head and Shoulders" pattern at the peak of the corrective move on the H4 time frame. There is a weak, but still a sell signal, where the area of the lower limit of 1.1700/1.1770 just intersects with the neckline of the chart pattern.
Analyzing yesterday's fifteen-minute, we can see that the highest activity took place during the Asian session and the start of the European session. After that, the activity in the market declined with each passed hour, ending the trading day with consolidation.
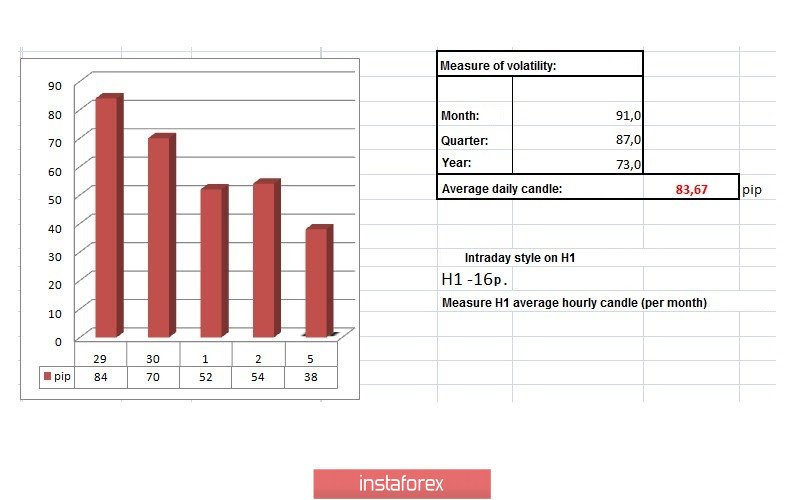
In terms of daily dynamics, extremely low indicators of 52 and 54 points were recorded for two days in a row, which is reflected in the market by the existing stagnation. Meanwhile, speculative activity is recorded exclusively on minute and hour periods.
As discussed in the previous analytical review, traders take a wait-and-see position, monitoring the price breakout from stagnation, which can lead to a sharp surge in activity.
Considering the trading chart in general terms (daily period), it can be seen how the price returned to the limits of the previously passed flat 1.1700//1.1810//1.1910, but the concentration of trading forces is still within the lower limit of 1.1700, which still leaves a chance for a downward development in the market.
Last Friday's news background contained preliminary data on inflation in Europe, where it recorded a further decline from -0.2% to -0.3%. This is considered a very bad signal in terms of a possible cut in interest rates from the European Central Bank.
In the afternoon, a report by the United States Department of Labor was published, which turned out to be much better than forecasts. So, the unemployment rate fell from 8.4% to 7.9%, against the forecasted 8.3%, and 661,00 new jobs were also created outside agriculture.
Although fewer jobs were created than predicted, everything is covered by the unemployment rate, which inspires investors with a confident recovery in the labor market.
From the above data, it can be seen that the statistics favor the US dollar, but the market, as before, ignores it. The reason lies in the high degree of emotionality of market participants and pressure from the information background.
So, the information flow focuses on topics that are exciting for everyone: Brexit and COVID-19. Regarding the first point, there are huge disagreements and even threats on both sides, and on the second point, the fear of the second wave and the update of infection maximums, where the US President, D. Trump, who was diagnosed with coronavirus, has already come under attack.
At the same time, the pressure on investors comes from the US upcoming elections, where there is less than a month left until the d-day.
Now, it is worth paying special attention to the information flow by analyzing hot topics, since impulse outbursts can arise just on the basis of them, and not due to statistical data.
In terms of the economic calendar, data on retail sales in Europe will be published today. They are expected to accelerate from 0.4% to 1.8%, which is considered a good signal for the strengthening of the Eurocurrency in terms of fundamental analysis. It is worth considering that the reaction may be insignificant, and the market will continue to focus on the information flow.
EU 9:00 Universal time - Volume of retail sales in August
Further development
Analyzing the current trading chart, price fluctuations in the same price range 1.1700/1.1770 can be seen, where active upward interest was observed during the Asian session, which led to another rebound from the lower limit of the variable range. It can be assumed that the price movement in the given range will still persist in the market, where the main activity will arise beyond its borders.
The optimal trading tactic is the method of breaking through the established borders, where entering the position is carried out based on the fixing points 1.1685/1.1775. The trading method refers to the horizontal approach, since if we proceed from the downward tact of the past month and the breakdown of the seven-week side channel of 1.1700/1.1910, the chance of a downward development in the medium term is higher than with an upward development.
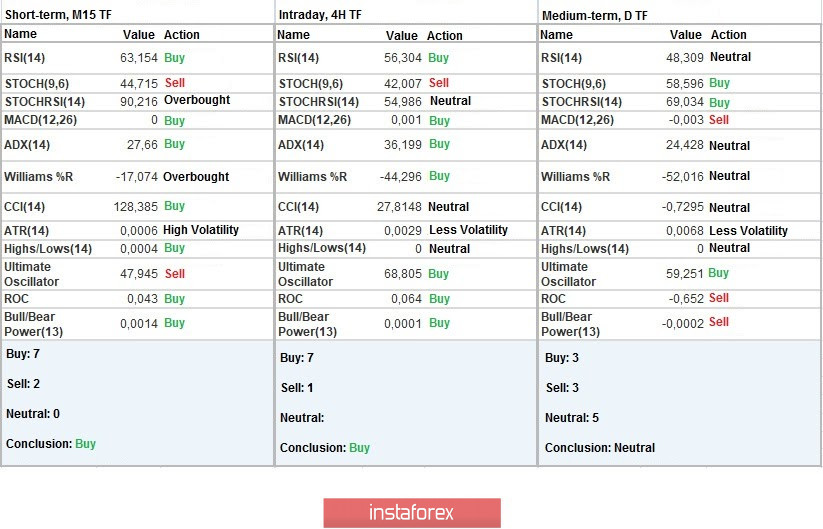
Indicator analysis
Analyzing different sectors of time frames (TF), we see that the indicators of technical instruments on minute and hourly intervals signal a buy, but it should be considered that the signal is unstable and changes taking into account price fluctuations within stagnation of 1.1700/1.1770. In turn, the daily period has a neutral signal, which is considered a fair marker.
Weekly volatility / Volatility measurement: Month; Quarter; Year
Measurement of volatility reflects the average daily fluctuation, calculated per Month / Quarter / Year.
(It was built considering the time of publication of the article)
The volatility of the current time is 38 points, which is 54% below the daily average. We can assume that if the given range breaks down without having a direction value, a surge in activity will occur, which will lead to an increase in volatility.
Key levels
Resistance zones: 1.1755/1.1770*; 1.1910 **; 1.2000***; 1.2100 *; 1.2450**; 1.2550; 1.2825
Support zones: 1.1700; 1.1650 *; 1.1500; 1.1350; 1.1250 *; 1.1180**; 1.1080; 1.1000***.
* Periodic level
** Range level
*** Psychological level