To open long positions on EURUSD, you need:
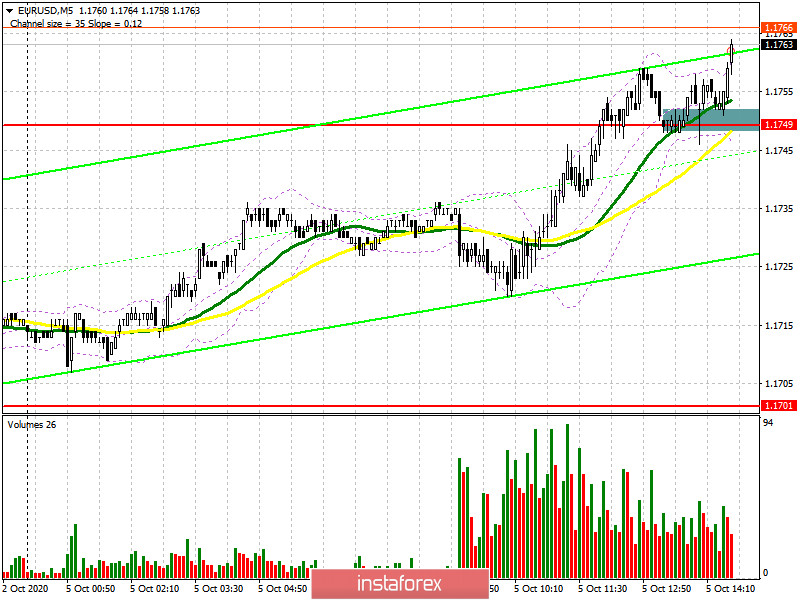
In the first half of the day, I paid attention to purchases after the breakdown and consolidation above the resistance of 1.1749, which happened. Good fundamental data on the activity of the service sector in the Eurozone, which turned out to be slightly better than the preliminary values, helped to maintain the bullish momentum in the pair, and a sharp jump in retail sales in the Eurozone supported this positive note. If you look at the 5-minute chart, you will see how the bulls still consolidated above 1.1749 and the test of this level on the reverse side led to the formation of a good entry point for long positions.
As long as trading is above the support of 1.1749, the nearest target for bulls will be resistance of 1.1796, after the test of which I recommend taking profit, since volatility does not promise to be high today. Also, if there is no bull activity in the area of the weekly high, where trading is currently underway, after the publication of similar data for the United States in the afternoon, it is best to postpone long positions until the test of the larger support of 1.1701, where you can buy EUR/USD immediately on the rebound in the expectation of a correction of 20-30 points within the day. If the bullish momentum continues and we see a breakout of 1.1796, you can open new long positions after fixing above this range with the main goal of growth to the area of the maximum of 1.1833, where I recommend fixing the profits.
To open short positions on EURUSD, you need:
Sellers have a new task for the second half of the day, and it is to return the pair to the support level of 1.1749. A test of this level from the bottom up will form a good entry point into short positions, which will increase the pressure on EUR/USD and lead to an update of the minimum of 1.1701, where I recommend fixing the profits. If the bears continue to watch everything on the sidelines, it is better not to rush with sales, but wait for the resistance update at 1.1796 and sell the euro from there immediately on the rebound in the expectation of a correction of 20-30 points within the day. The direction will most likely be determined by the data on the US non-manufacturing sector.
Let me remind you that the COT report (Commitment of Traders) for September 29 recorded a reduction in both long and short positions, which led to a decrease in the delta. Apparently, the lack of benchmarks and a surge in the incidence of coronavirus in Europe discouraged major players from building up long positions in the euro, however, no one is in a hurry to buy the US dollar because of the upcoming US presidential election. Thus, long non-profit positions decreased from 247,049 to 241,967, while short non-profit positions decreased from 56,227 to 53,851. The total non-commercial net position also fell to 188,116 against 190,822 a week earlier, indicating a wait-and-see attitude for new players. However, the bullish sentiment for the euro remains quite high in the medium term. The more the euro declines against the US dollar, the more attractive it will be for new investors.
Signals of indicators:
Moving averages
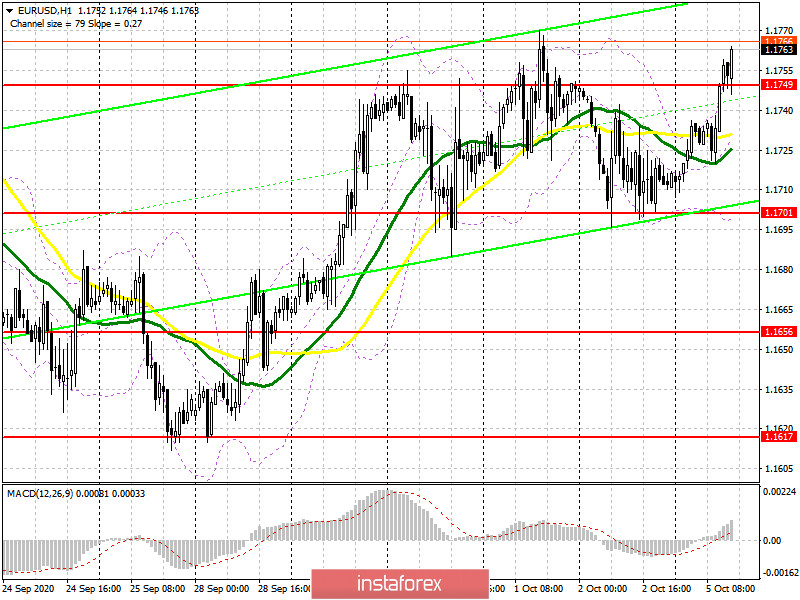
Trading is above 30 and 50 daily moving averages, which may lead to a resumption of bullish momentum in the euro.
Note: The period and prices of moving averages are considered by the author on the hourly chart H1 and differ from the general definition of the classic daily moving averages on the daily chart D1.
Bollinger Bands
If the pair declines, support will be provided by the lower border of the indicator in the area of 1.1701, from which you can buy the euro immediately for a rebound.
Description of indicators
- Moving average (moving average determines the current trend by smoothing out volatility and noise). Period 50. The graph is marked in yellow.
- Moving average (moving average determines the current trend by smoothing out volatility and noise). Period 30. The graph is marked in green.
- MACD indicator (Moving Average Convergence / Divergence - moving average convergence / divergence) Fast EMA period 12. Slow EMA period 26. SMA period 9
- Bollinger Bands (Bollinger Bands). Period 20
- Non-profit speculative traders, such as individual traders, hedge funds, and large institutions that use the futures market for speculative purposes and meet certain requirements.
- Long non-commercial positions represent the total long open position of non-commercial traders.
- Short non-commercial positions represent the total short open position of non-commercial traders.
- Total non-commercial net position is the difference between the short and long positions of non-commercial traders.