Analysis of previous deals:
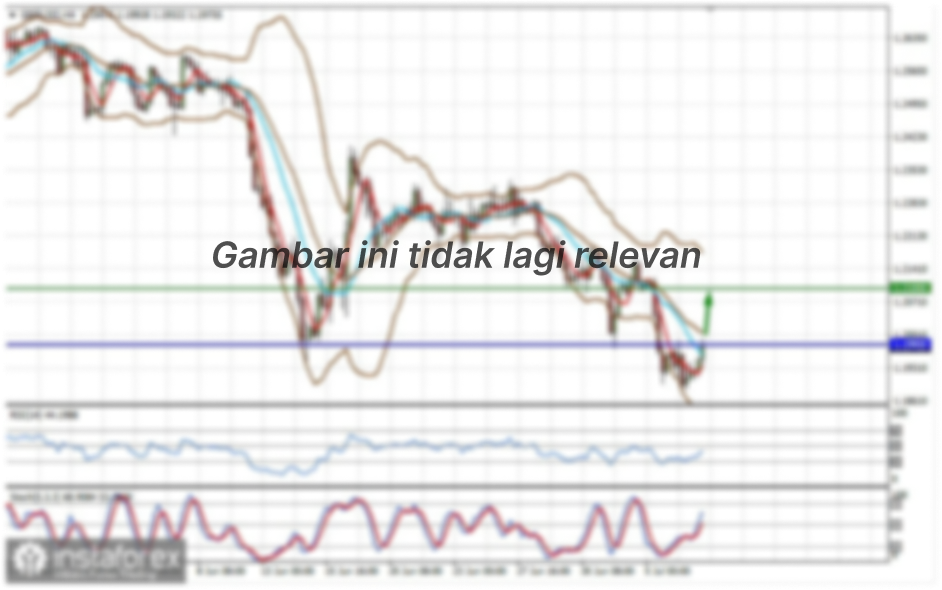
30M chart of the EUR/USD pair
One could say that the EUR/USD pair began a strong downward movement last Friday for no reason at all. We will look into why this happened. There can be several reasons, starting with the desire of traders to take some of the profits on long positions at the end of the month, ending with purely technical reasons. The fact remains. The euro fell 110 points, although volatility was no more than 40 points a day for most of the week. Of course, one can immediately think of macroeconomic reports, especially since there were a lot of them on Friday. However, we can immediately say that none of the published reports had a clear impact on the pair. Moreover, most of the reports can be interpreted in any way. At least in favor of the dollar, and in favor of the euro. Thus, it is generally impossible to find any connection between the pair's movement and the macroeconomic background. In fact, there is nothing to analyze on the hourly timeframe, since there wasn't any signal during the entire day. Let us remind novice traders that there is still an upward trend on this timeframe, thanks to the trend line. And so, we only consider buy signals from the MACD indicator, of which there were none last Friday.
5M chart of the EUR/USD pair
Now let's take a look at the 5 minute timeframe. Here we have formed at least five signals. The downward movement started at the beginning of the European trading session, but, unfortunately, there wasn't any level in that area, around which a signal could form. Nevertheless, it formed at the very end of the European session - the price surpassed the 1.2092 level, and a little later a second sell signal was formed - a rebound from the 1.2092 level. Beginners could open short positions for any of them. The price fell after forming this signal, 30 points and 40 points, and reached the three nearest support levels: 1.2056, 1.2044 and 1.2023. Thus, novice traders could take profits anywhere. The least they would have earned 30 points, the most - 60. Only the last fifth signal could spoil the excellent trading statistics of the day by a bit, since it was a long position on the rebound from 1.2023. The signal turned out to be false, as the bulls could not even push the pair up by 20 points. And so, beginners could still lose 10 points. However, opening a long position implies that traders held short positions to 1.2023, that is, they earned 60 points.
How to trade on Monday:
The price may slightly move up on Monday, however, in general, the downward movement may continue in the direction of the uptrend line on the 30-minute timeframe. Therefore, one should be wary of buy signals on this timeframe. On the other hand, the MACD indicator is still too low, so in any case it needs to go up to the zero level, and only after that can we expect a buy signal to appear. Beginners can trade from levels 1.2056, 1.2044, 1.2023, 1.1999 and 1.1990 on the 5-minute timeframe for a rebound or breakthrough in both directions. Take Profit, as before, is set at a distance of 30-40 points. Stop Loss - to breakeven when the price passes in the right direction by 15-20 points. Recall that it is best to trade using the most accurate and clear signals, and ignore inaccurate ones. The European Union and the US will publish reports on business activity in the areas of manufacturing. Therefore, you should pay attention to their release.
On the chart:
Support and Resistance Levels are the Levels that serve as targets when buying or selling the pair. You can place Take Profit near these levels.
Red lines are the channels or trend lines that display the current trend and show in which direction it is better to trade now.
Up/down arrows show where you should sell or buy after reaching or breaking through particular levels.
The MACD indicator (14,22,3) consists of a histogram and a signal line. When they cross, this is a signal to enter the market. It is recommended to use this indicator in combination with trend lines (channels and trend lines).
Important announcements and economic reports that you can always find in the news calendar can seriously influence the trajectory of a currency pair. Therefore, at the time of their release, we recommended trading as carefully as possible or exit the market in order to avoid a sharp price reversal.
Beginners on Forex should remember that not every single trade has to be profitable. The development of a clear strategy and money management are the key to success in trading over a long period of time.


