empty
 
 
06.07.2022 11:39 PM
Technical analysis of AUD/USD for July 06, 2022

This image is no longer relevant

Overview :

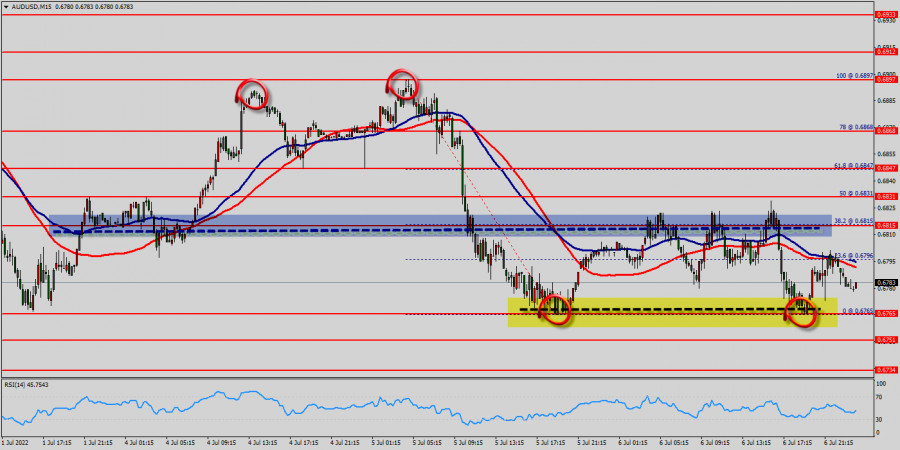
The bears mustn't break through 0.6815 in order to resume the downtrend. The trend of AUD/USD pair movement was controversial as it took place in the downtrend channel. Due to the previous events, the price is still set between the levels of 0.6765 and 0.6815, so it is recommended to be careful while making deals in these levels because the prices of 0.6815 and 0.6765 are representing the resistance and support respectively. Therefore, it is necessary to wait till the downtrend channel is passed through. Then the market will probably show the signs of a bearish market. In other words, sell deals are recommended below the price of 0.6815 with the first target at the level of 0.6765. From this point, the pair is likely to begin an descending movement to the price of 0.6815 with a view to test the daily support at 0.6751.

Forecast :

If the pair fails to pass through the level of 0.6815, the market will indicate a bearish opportunity below the strong resistance level of 0.6815. In this regard, sell deals are recommended lower than the 0.6815 level with the first target at 0.6765. It is possible that the pair will turn downwards continuing the development of the bearish trend to the level 0.6751. However, stop loss has always been in consideration thus it will be useful to set it above the last double top at the level of 0.6847 (notice that the major resistance today has set at 0.6847).

Daily key levels :

  • Major resistance: 0.6847
  • Minor resistance: 0.6831
  • Pivot point: 0.6815
  • Minor support: 0.6715
  • Major support: 0.6751

Comment :

  • - The trend is still calling for a strong bearish market from the spot of 0.6815.
  • - Sellers are asking for a high price.
  • - Please check out the market volatility before investing, because the sight price may have already been reached and scenarios might have become invalidated.
  • - The price channel is a limited trading range in which the price moves during a certain period of time. In other words, it is a "corridor" on the price chart. The boundaries of the price channel are outlined by two lines: resistance and support.
  • - A resistance level is a price level from which price reverses as it approaches from the bottom to the top. This level is as if it is resisting the price, preventing it from going higher.
Dapatkan keuntungan dari perubahan nilai mata uang kripto dengan InstaForex.
Unduh MetaTrader 4 dan buka perdagangan pertama Anda.
  • Grand Choice
    Contest by
    InstaForex
    InstaForex always strives to help you
    fulfill your biggest dreams.
    GABUNG KONTES
  • Chancy Deposit
    Isi akun Anda sebesar $3000 dan dapatkan $9000 lebih banyak!
    Pada Mei kami mengundi $9000 dalam promo Chancy Deposit!
    Dapatkan kesempatan untuk menang dengan melakukan deposit sebesar $3000 pada akun trading Anda. Setelah memenuhi persyaratan ini, Anda telah menjadi partisipan promo.
    GABUNG KONTES
  • Trade Wise, Win Device
    Top up akun anda dengan dana minimal $500, daftar kontes, dan dapatkan peluang untuk memenangkan perangkat seluler.
    GABUNG KONTES
  • 100% Bonus
    Kesempatan langka untuk mendapatkan bonus 100% pada deposit anda
    DAPATKAN BONUS
  • 55% Bonus
    Ajukan bonus 55% pada setiap deposit anda
    DAPATKAN BONUS
  • 30% Bonus
    Raih bonus 30% setiap kali anda top up
    DAPATKAN BONUS

Artikel yang direkomendasikan

Tidak bisa bicara sekarang?
Tanyakan pertanyaan anda lewat chat.
Widget callback