EUR/USD 5M
The EUR/USD pair traded extremely weakly again on the fourth trading day of the weak. A day earlier, volatility was more than 60 points. Therefore, as they say, a little bit of good. The volatility of the penultimate trading day of the week was less than 40 points again. Thus, the euro/dollar pair continues to creep upwards, however, this is still an upward movement, which fully meets our expectations. Recall that we expect the global upward trend to resume and the quotes return to at least 1.2240. So far, everything is going according to plan, but very slowly. During Thursday, not a single important macroeconomic report was published either in the US or in the European Union. There were only minor ones, which did not have any influence on the course of trading. Nevertheless, as many as three signals were formed during the day. Naturally, everything is near one and the same level, since it is not necessary to count on another during a flat. Let's take a look at how you should have traded yesterday. The first signal - a rebound from the extremum level of 1.1852 - should have been worked out with a short position. But the sell signal turned out to be false, and the price could not go down even 10 points. The price returned to the 1.1852 level almost immediately and bounced off again. At this time, traders should have continued to be short, as there was no signal to cancel the sell signal. However, even on the second attempt, the pair was unable to start moving down, therefore, as a result, the quotes settled above the level of 1.1852, and this was already a buy signal. A short position should have been closed here at a loss of about 15 points and a long position should have been opened. Since the volatility was still extremely weak, the most that traders could count on was a profit on a trade of 10-15 points, which would completely cover the loss on the first trade. Unfortunately, the pair continues to trade ultra weakly.
Overview of the EUR/USD pair. September 3. EU and US central banks: Much talk, little deal.
Overview of the GBP/USD pair. September 3. Formal concessions to Scotland were made in Great Britain.
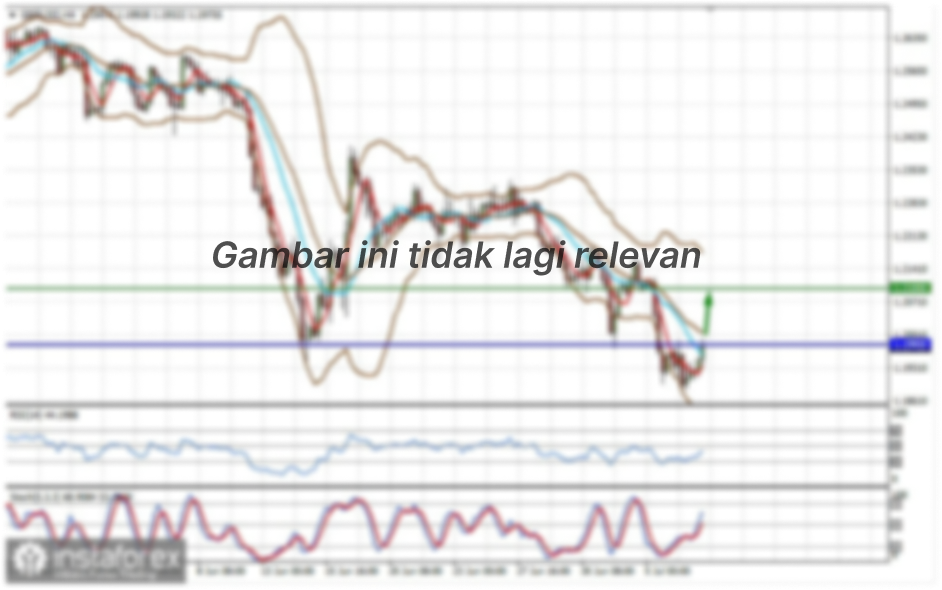
EUR/USD 1H
You can clearly see that the price continues its upward movement within the rising channel on the hourly timeframe. The movement looks even relatively strong. However, this is an illusion. Despite the fact that about 200 points have been passed over the past two weeks, the movements themselves remain extremely weak. Nevertheless, the upward trend remains relevant. Before the price settles below the channel, bullish trading should be considered more. On Friday, we continue to recommend considering trading from important levels and lines. The closest important levels at this time are 1.1750, 1.1805, 1.1857, 1.1894, 1.1922, as well as the Senkou Span B (1.1736) and Kijun-sen (1.1801) lines. The Ichimoku indicator lines can change their position during the day, which should be taken into account when looking for trading signals. Signals can be rebounds or breakthroughs of these levels and lines. Do not forget about placing a Stop Loss order at breakeven if the price moves 15 points in the right direction. This will protect you against possible losses if the signal turns out to be false. On September 3, the European Union will publish reports on retail sales and business activity in the service sector for August. Under a certain set of circumstances, they can affect the pair's movement. However, much more important and significant reports will be published in the US this afternoon. First of all, we are talking about the NonFarm Payrolls report. The forecast for it is 750,000. Any value below this could trigger another fall in the US dollar. The ISM index and the unemployment rate will also be quite important. They can also be reflected in the EUR/USD pair movement chart. Volatility should also be higher than usual today.
We also recommend that you familiarize yourself with the forecast and trading signals for the GBP/USD pair.
COT report
The EUR/USD pair fell by 30 points during the last reporting week (August 17-23). So, for now, judging by the chart of the European currency, traders are still in a bearish mood. However, both indicators in the chart above indicate that the bullish mood among the major players remains, which is indirectly another factor that speaks in favor of the resumption of the upward trend in the EUR/USD pair. The non-commercial group of traders, which is the most important, still has more open contracts to buy than sell. This value has been declining recently, but it is still bullish. The mood of professional players became more bearish during the reporting week. The non-commercial group has closed almost 40,000 Buy contracts (longs) and only 7,200 Sell contracts (shorts). Thus, the net position immediately decreased by 33,000. This suggests that the process of selling the European currency continues. However, we knew this and judging simply by the chart of the EUR/USD pair. We believe that the failure to overcome the 1.1700 level will preserve the scenario with a new upward trend, no matter how much the net position of non-commercial traders declines. Because the technique eloquently indicates a very likely renewal of the upward movement. But if the price overcomes the 1.1700 level, big players may feel that this is not just a correction, but a new downward trend and continue to build up short positions. Therefore, in a way, the euro/dollar pair is now at a very important point, price and time.
Explanations for the chart:
Support and Resistance Levels are the levels that serve as targets when buying or selling the pair. You can place Take Profit near these levels.
Kijun-sen and Senkou Span B lines are lines of the Ichimoku indicator transferred to the hourly timeframe from the 4-hour one.
Support and resistance areas are areas from which the price has repeatedly rebounded off.
Yellow lines are trend lines, trend channels and any other technical patterns.
Indicator 1 on the COT charts is the size of the net position of each category of traders.
Indicator 2 on the COT charts is the size of the net position for the non-commercial group.


