After yesterday's jump above the range of $60.2K-$64.54K, bitcoin resumed its upward movement and set a new all-time high at $68.4K. A bit later, the asset rolled back to $66.8K as expected. Since the coin broke the narrow range, now traders have more opportunities for scalping and futures trading. In order to determine profitable entry points and the medium-term trend, it is necessary to conduct a technical analysis.
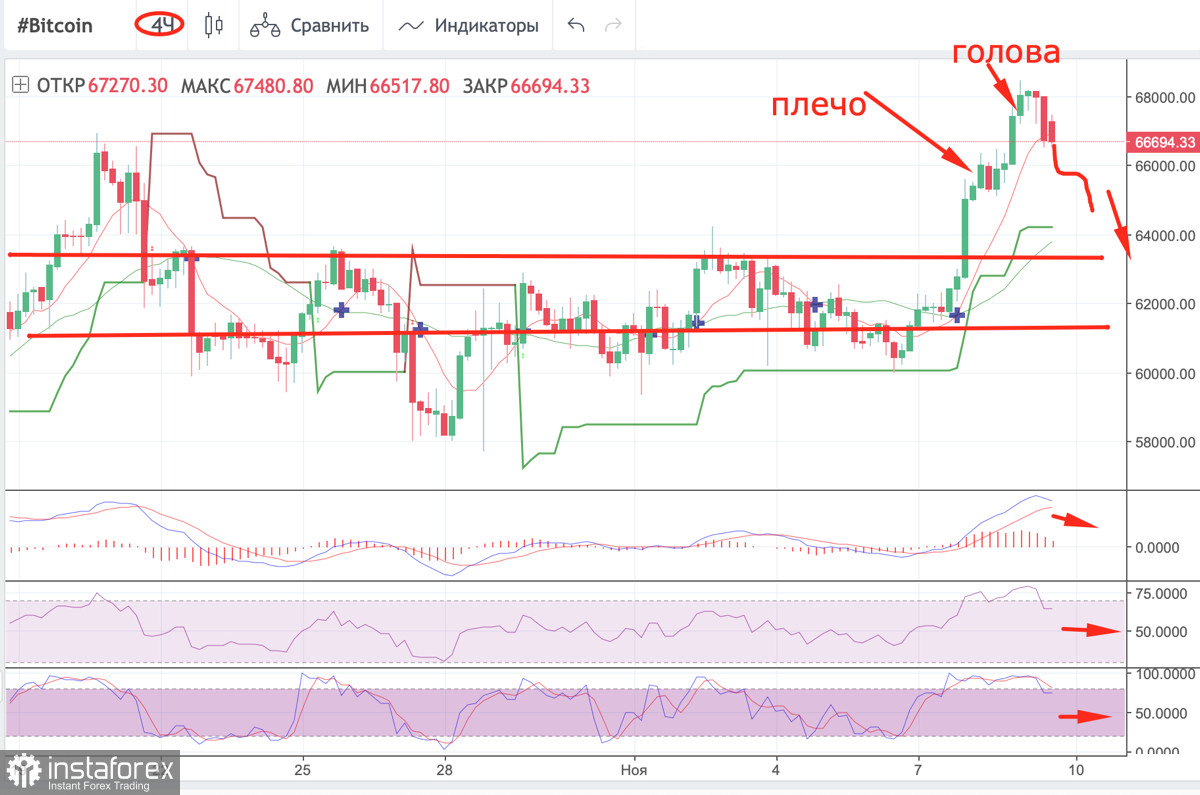
Let us take a look at the four-hour chart. After a confident bullish impulse, the Head and Shoulders pattern started its formation. It is a clear signal of a trend reversal. Notably, the pattern is under formation and it will be possible to talk about the full completion only after the formation of the neck line, which serves as a strong resistance zone. So far, we can see one shoulder and a head on the chart. That is why it is too early to draw conclusions. Once formation is completed, traders may open a short position in the neck line and place a stop loss at the shoulder level of the pattern. Interestingly, after setting a historical record, the price began a systematic downward movement and sellers finally took control over the market. At the same time, technical indicators began to recover, thus indicating a local trend change, which may stop the formation of the Head and Shoulders pattern. The MACD indicator is still declining, but it is showing the prerequisites for a sideways movement. Stochastic and the relative strength index are moving sideways in the bullish zone, pointing to a gradual weakening of the downward momentum. However, an analysis of a narrower time frame is needed to confirm this scenario.
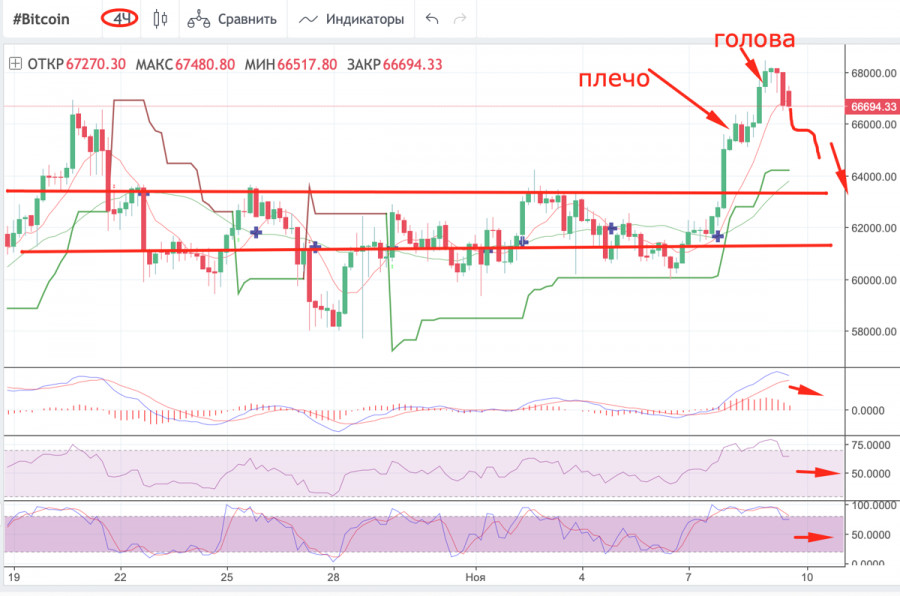
The Relative Strength Index (RSI) is a technical indicator that allows traders to determine the strength of a trend (descending or ascending), and warns of possible changes in the direction of the price movement. Thanks to it, it is possible to determine whether the asset is overbought or oversold. For the four-hour chart, the reading of 60 is really good as it indicates a high demand for the coin and the strength of the current upward momentum.
MACD (convergence/divergence of moving averages) is an indicator that allows traders to draw certain conclusions about the trend based on the movement of moving averages. The usual bullish signal occurs when a white line upwardly crosses the red one, whereas a bearish signal occurs when a white line downwardly crosses the red line.
Stochastic (stochastic oscillator) indicates the strength of the momentum of the current prevailing trend. If the indicator is above the 80 mark, then the asset could be considered overbought. If stochastic is below 20, then this is an oversold asset signal.
A supertrend line is a technical indicator reflecting a bullish (green - a buy signal) and bearish (red - a sell signal) trend on the horizontal charts of the cryptocurrency.
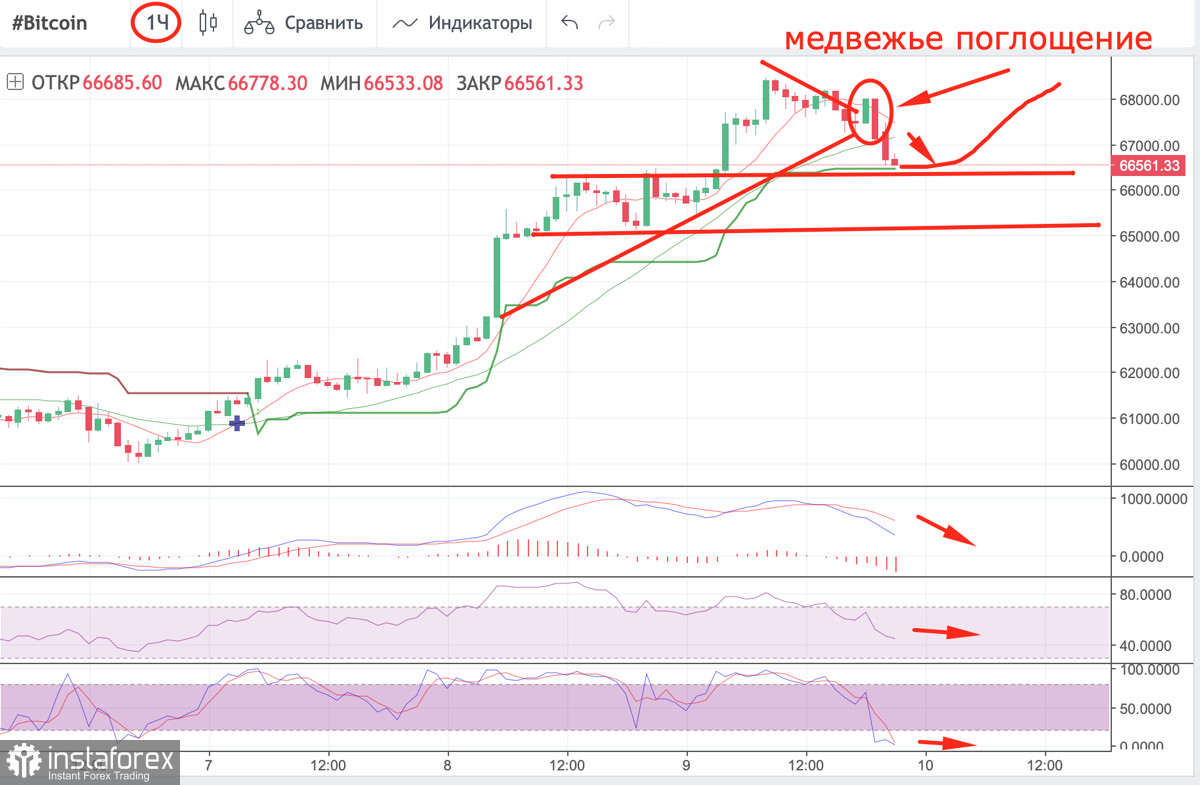
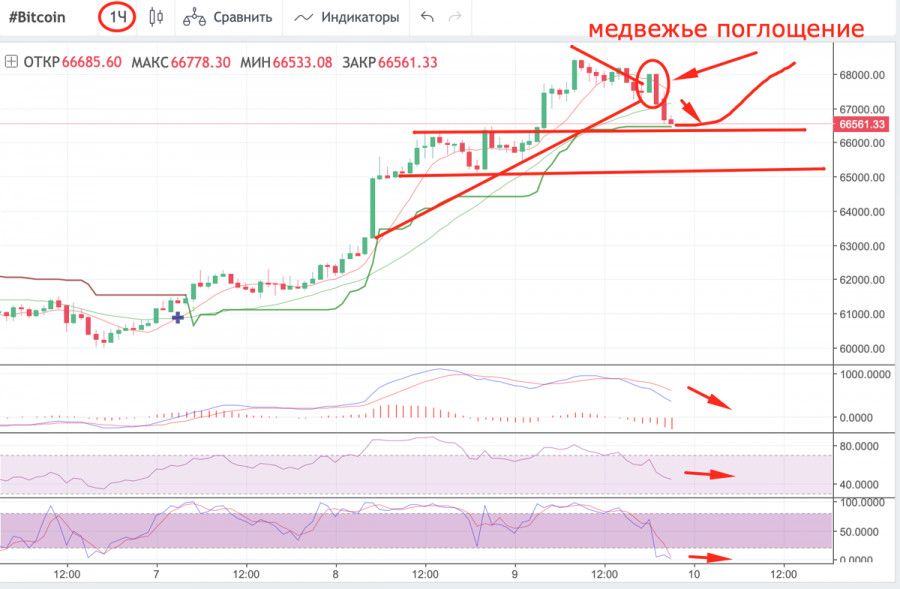
On the hourly chart, we see that BTC dropped after reaching its all-time high. It is quite possible that it will go on falling. A local pattern of bearish absorption was formed just after the breakout of the triangle. In other words, a bigger red candle was formed after a green candle. This means that bears are likely to take control over the market. This is also a clear signal to open short positions. The price made a bearish breakdown of the supertrend line, proving a further decline. Notably, the cryptocurrency is still within the support area and has not yet crossed its lower limit. That is why it still may rebound. If the price breaks $65.7K, traders may open short positions with a stop loss near $66.1K. According to the technical charts, BTC made an attempt to reverse, but failed. The MACD indicator continues a downward movement like stochastic and RSI. All charts are gradually moving into a bearish zone. Thus, the probability of completing the Head and Shoulders figure on a four-hour chart is growing. At the same time, it is worth paying attention to the daily chart.
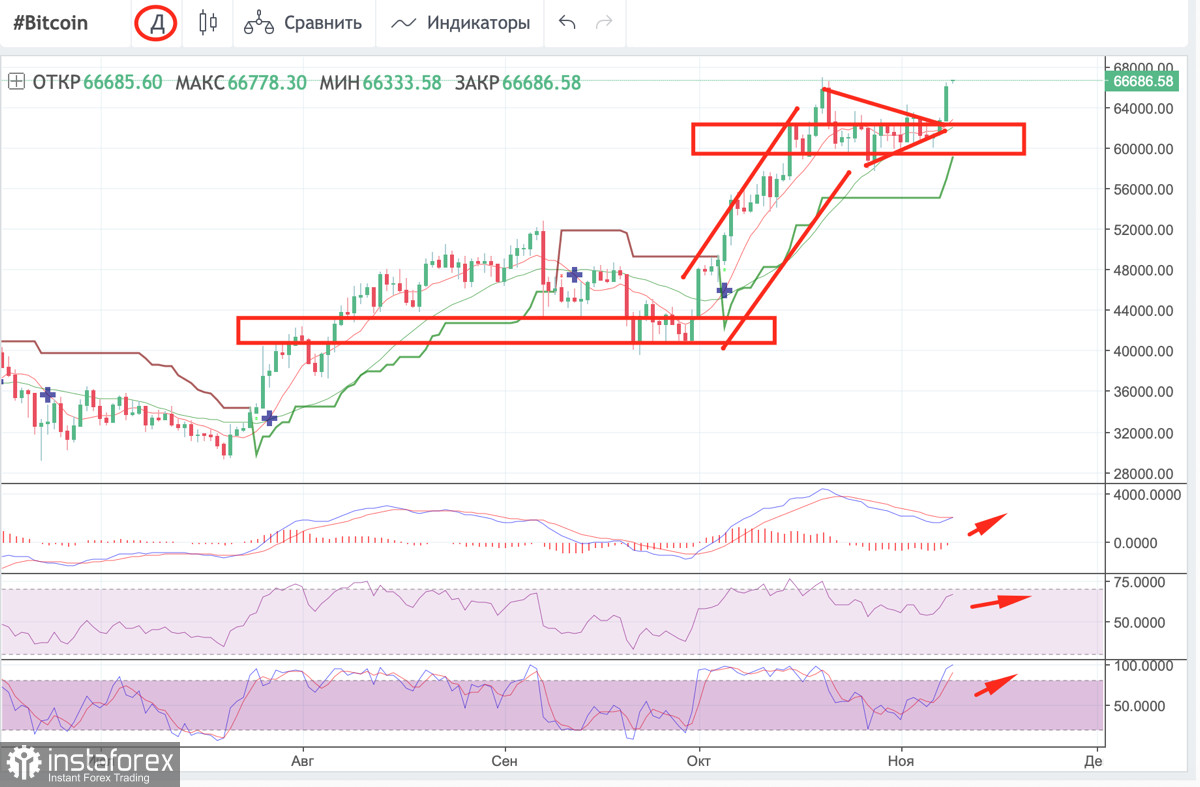
On the daily chart, BTC formed a green candle, showing a significant jump. The local support level is at $62.9K. The technical indicator remains bullish. It managed to resume rising after a slight drop. MACD formed a bullish crossing and began climbing. Meanwhile, the RSI indicator is in the bullish zone. This proves that the BTC price is stable and may jump higher. If the mid-term forecast comes true, BTC will meet a resistance level near $74.8K. Otherwise, the price may meet the nearest support levels located at $56.7K and $53.5K.