GBP/USD 5M
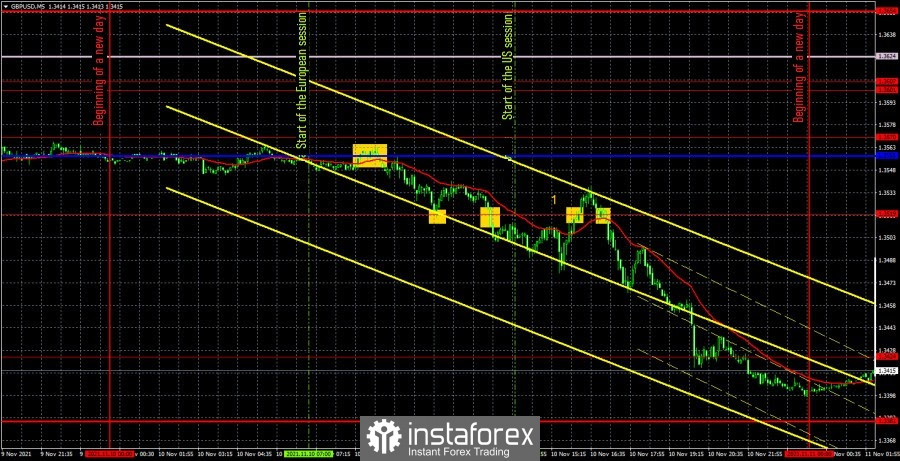
The GBP/USD pair traded pretty well on November 10 when only volatility is taken into account. In just a day, about 100 points were passed, which is not bad at all. However, if we consider the movements themselves during the day, it becomes clear that many signals could be unprofitable. In total, the pair unfolded at least four times on Wednesday. Nevertheless, no flat was fixed on the 4-hour timeframe yesterday, so signals from the Ichimoku indicator lines could be worked out. As far as "macroeconomics" and "foundation" are concerned, only one report could provoke (and, ultimately, provoked) a strong movement - the report on inflation in the United States (number "1" in the chart). Let's start "debriefing". The first sell signal has just formed near the Kijun-sen line. The price bounced off it, so traders could open short positions. The downward movement already ended near the level of 1.3519, as the price bounced off it, forming a false buy signal. Therefore, it was necessary to close short positions (profit of about 20 points) and open longs. Long positions also had to be closed rather quickly, as the pair settled below 1.3519 on the second attempt. Therefore, at this moment, new shorts should have been opened. And a loss of 13 points was received on the long position. In total, the price went down after a sell signal of 30 points, which was enough to set Stop Loss to breakeven, but not enough to reach the nearest level. Therefore, a short position could be closed at minimal profit if traders exited it manually before the inflation report was published, or by Stop Loss. The last two buy and sell signals should not have been worked out, since by that time two false signals had already formed near the level of 1.3519. As a result, the day ended with minimal profit.
GBP/USD 1H
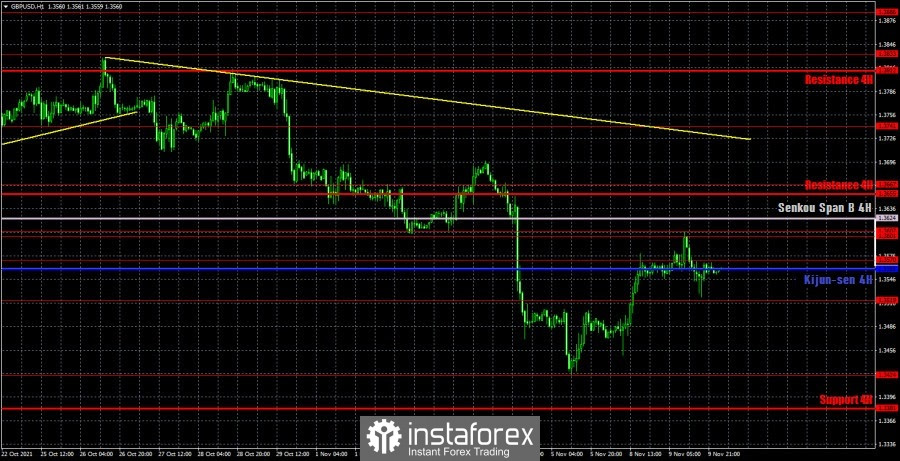
On the hourly timeframe, the pound/dollar pair maintains a downward trend, as the price continues to stay below the trend line. And the trend line continues to be located very far from the price. The pair did not manage to overcome the Ichimoku cloud, and on the 4-hour TF it is clearly visible that it did not even come close to it. And at this time it is located below Kijun-sen, so there is a high probability now that we are going downwards. Although we expected over the weekend that the British currency will start strong growth this week. But the report on inflation in the United States confused all the cards, since the British pound was just showing growth before it was published. We distinguish the following important levels on November 11: 1.3424, 1.3519, 1.3570, 1.3601 - 1.3607, 1.3667. Senkou Span B (1.3624) and Kijun-sen (1.3540) lines can also be signal sources. It is recommended to set the Stop Loss level at breakeven when the price passes in the right direction by 20 points. The Ichimoku indicator lines can move during the day, which should be taken into account when looking for trading signals. On Thursday, all the fun will happen in the UK. The third quarter economic growth report will be published here today. The rest of the reports can be considered secondary in the current circumstances. They will still be covered by the GDP report. The economy is expected to grow by 1.5% in the third quarter. However, we would like to remind you that in the United States the growth of 2.6% was also expected, but in reality it was only 2%. Thus, there may also be a serious undershoot to the forecast, which will put pressure on the pound's position.
We recommend you to familiarize yourself:
Overview of the EUR/USD pair. November 11. Inflation in the US has set a 30-year anti-record!
Overview of the GBP/USD pair. November 11. Britain must be prepared for a trade war with the European Union.
Forecast and trading signals for GBP/USD for November 11. Detailed analysis of the movement of the pair and trade deals.
COT report
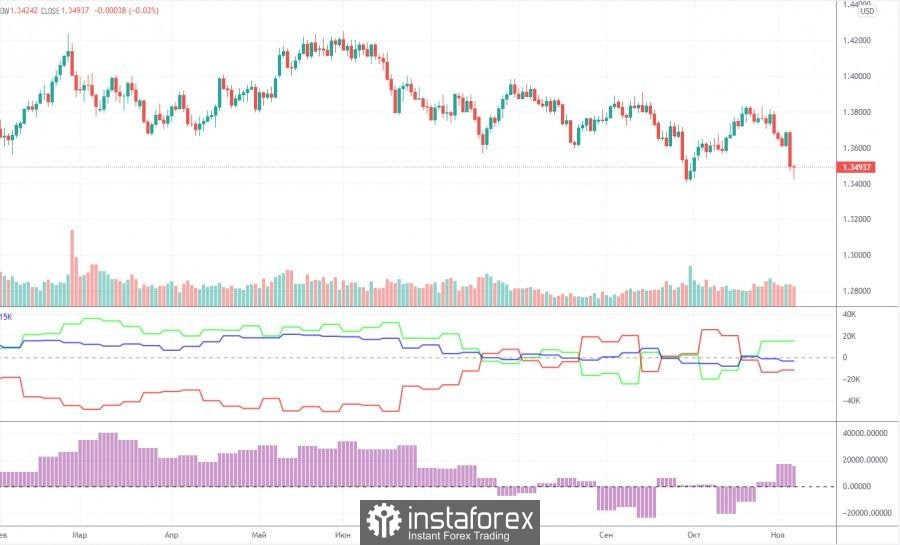
The mood of professional traders practically did not change during the last reporting week (October 26-November 1). However, it should be noted that the two most important days of last week – Wednesday and Thursday - when all the strongest movements occurred, were not included in the latest report. That is, in a week we will be able to see how much and in which direction the mood of professional traders has changed. In the meantime, we can only draw the same conclusions as a week ago. The green and red lines of the first indicator continue to constantly change the direction of movement, constantly intersecting. This suggests that big players themselves do not understand what to do with the pound. However, this can be clearly seen from the very schedule of the pair's movement, starting from July. These four months, the pound/dollar pair has been between the levels of 1.3400 and 1.4000, that is, in the horizontal channel. It was during this period of time that commercial and non-commercial traders changed their mood almost every week. Thus, taking into account the previous changes, we would assume that a new growth of the British currency will begin in the near future with the prospect of a 500-point rise. Moreover, the results of the Bank of England meeting were not dovish. The British currency has fallen undeservedly, which means that the markets may soon recoup this injustice. It should also be noted that during the reporting week, professional traders opened 5.8 buy contracts (longs) and 7.5 thousand sell contracts (shorts). Thus, the net position has not changed much.
Explanations for the chart:
Support and Resistance Levels are the levels that serve as targets when buying or selling the pair. You can place Take Profit near these levels.
Kijun-sen and Senkou Span B lines are lines of the Ichimoku indicator transferred to the hourly timeframe from the 4-hour one.
Support and resistance areas are areas from which the price has repeatedly rebounded off.
Yellow lines are trend lines, trend channels and any other technical patterns.
Indicator 1 on the COT charts is the size of the net position of each category of traders.
Indicator 2 on the COT charts is the size of the net position for the non-commercial group.


