Technical data:
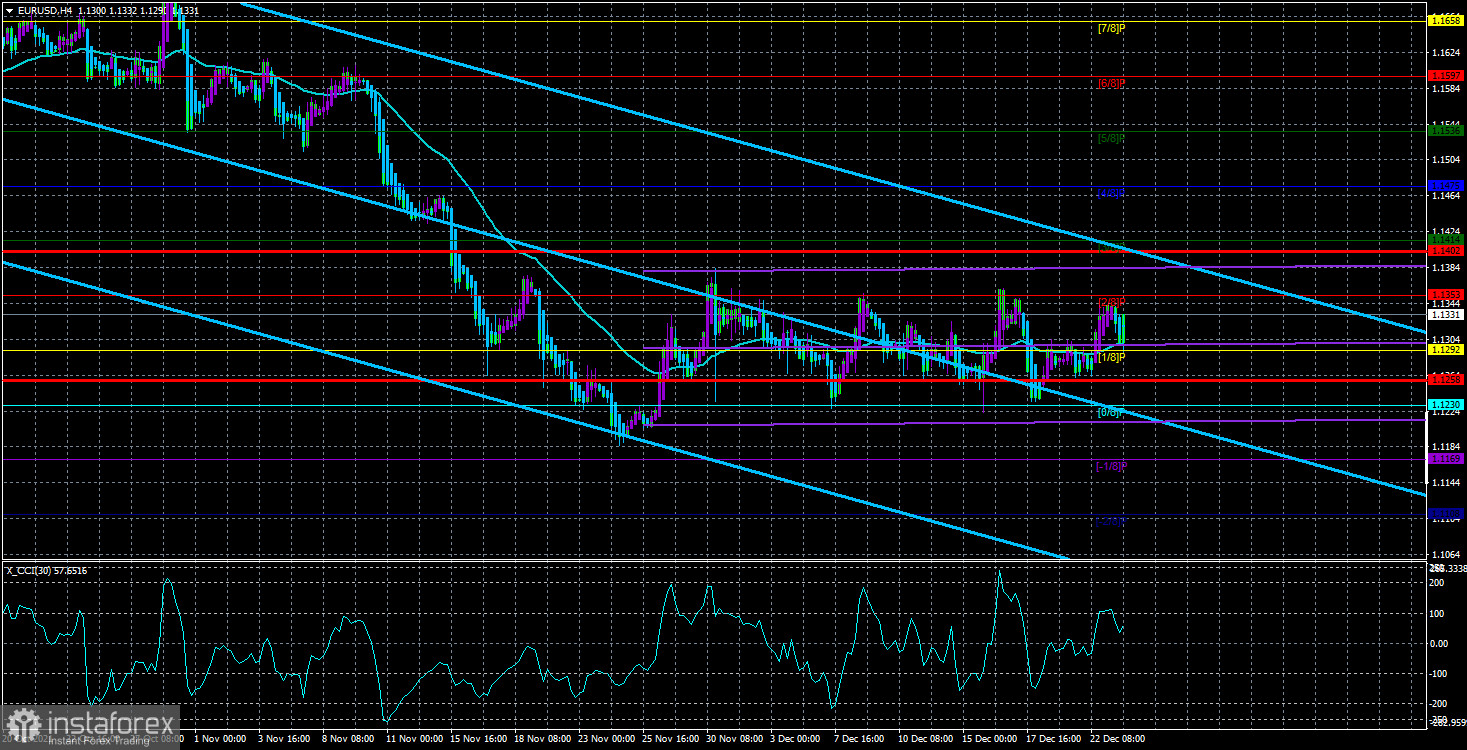
Upper Linear Regression Channel is headed down
Lower Linear Regression Channel is headed down
Moving average (20-day period, smoothed) - sideways movement
The EUR/USD pair was moving within the sideways channel between the 0/8 Murray level (1.1230) and the 2/8 Murray level (1.1353) on Thursday. So, the quote has been trading sideways for almost a month. To leave this cannel, either strong fundamentals are needed or a breakout of any of the channel's limits amid a thin market. However, this is highly likely to happen matter-of-factly. At some point, a large commercial bank could enter the market with a major trade and the flat move will end. As a rule, when such a prolonged flat occurs, even meetings of central banks cannot help. Currently, numerous pending orders are set around both limits of the sideways channel. As soon as the price approaches any of the limits, pending orders trigger and the quote goes down. Even last week's meetings of the US Federal Reserve and the ECB did not affect EUR/USD. Above all else, Christmas and New Year are coming, and volatility is usually very low during the winter holidays as the number of traders is decreasing. Above all else, the macroeconomic calendar is almost empty at this time of the year and very few fundamental events occur. Therefore, markets have nothing to react to right now. For that reason, the pair may well continue trading within the sideways channel until the new year. At the same time, it does not mean that the quote has no chance of leaving the sideways channel.
What did happen to EUR in 2021? What the year 2022 has in store for the currency?
This year has not been fortunate for the euro. The pair has been in a downtrend since January 6, 2021. Of course, it sometimes retraced upward. At the same time, for a long time, we have considered the downtrend to be a correction versus the uptrend in 2020. A similar conclusion could be drawn even now because the pair has retraced by 61.8% since 2020. However, the lower the pair falls, the more slender is the chance of resuming the uptrend. Indeed, expectations of monetary policy tightening by the Federal Reserve have been the only reason for a bullish greenback in recent months. In other words, traders believed that the US regulator would announce QE tapering and rate hikes faster than the ECB. They were right. In this light, the dollar has swelled 600 pips for a couple of months. Meanwhile, the Fed has raised the interest rate not even once. However, if Omicron continues tightening its grip in the country, the regulator may postpone raising the rate to the middle or end of 2022. So, could the greenback be bullish solely on expectations all the time before rate hikes? It may well be the case when markets acted proactively. Both rate hikes and the QE program winddown have already been priced in. Thus, a new uptrend could start from the current levels. Anyway, there should be certain technical signals and confirmations of this assumption. So far, there have not been any. The price is moving sideways, and even breaking the critical line on the 24-hour time frame cannot be considered a buy signal. Consolidation above the MA on the 4-hour time frame cannot be regarded as a signal for the uptrend to start either. First and foremost, the price should leave the sideways range in order to consider where it could go next.
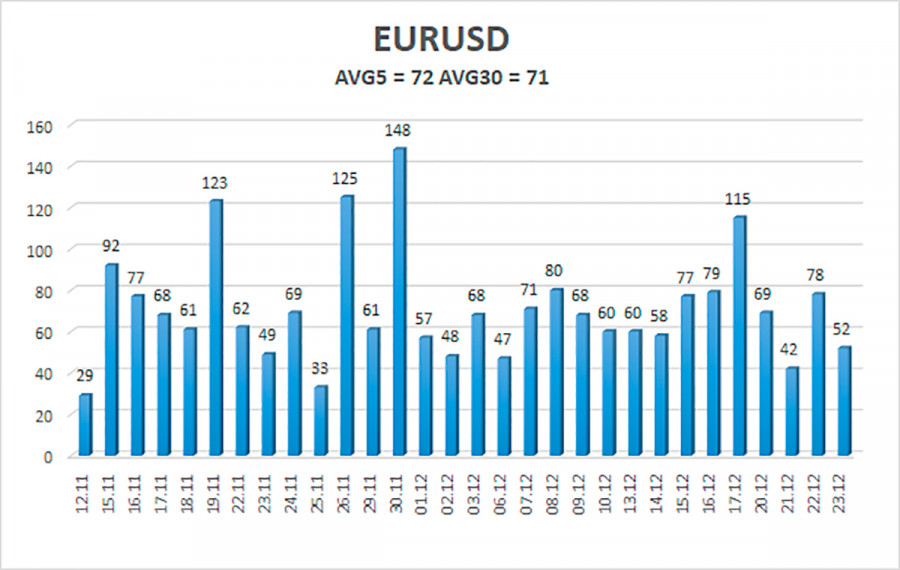
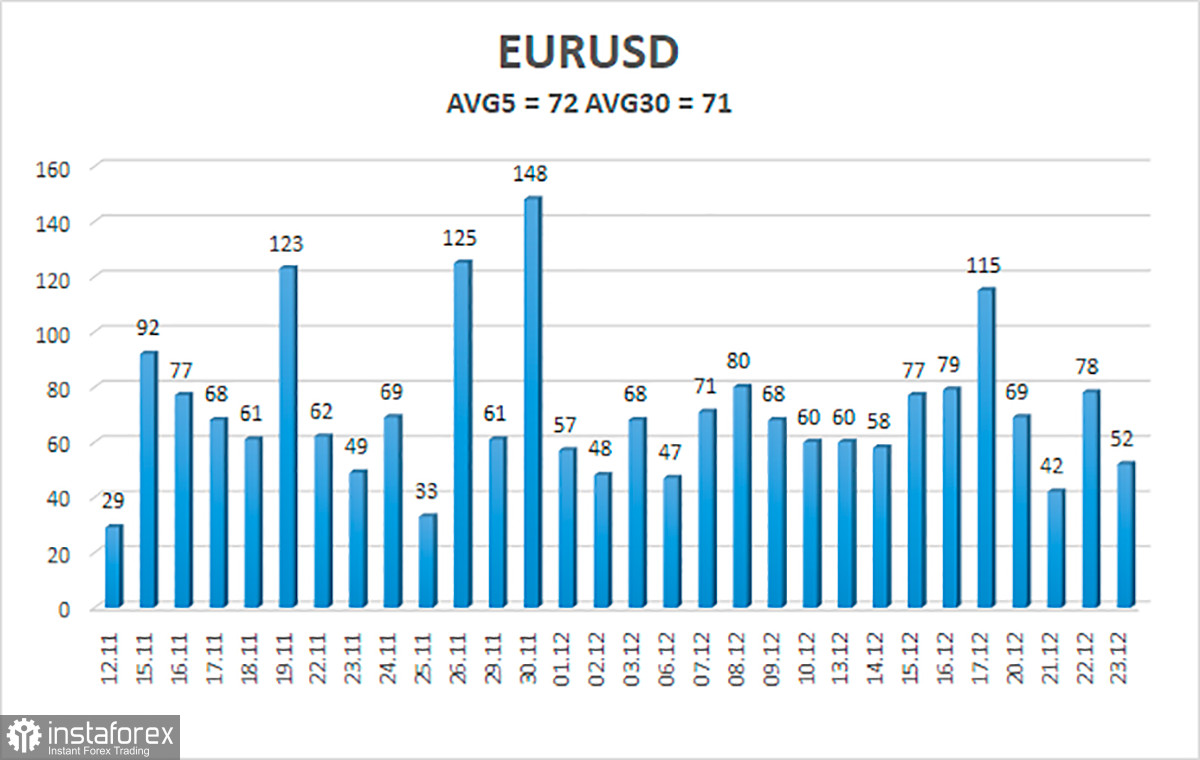
On December 24, the volatility of EUR/USD totals 72 pips. Today, the pair is expected to move in the range of 1.1258 and 1.1402. Heiken Ashi's upward reversal is likely to indicate the start of an uptrend within the sideways channel.
Closest support levels
S1 – 1.1292
S2 – 1.1230
S3 – 1.1169
Closest resistance levels
R1 – 1.1353
R2 – 1.1414
R3 – 1.1475
Outlook:
The EUR/USD is still moving within the sideways channel of 1.1230-1.1353. Trading could be carried out on a bounce from the upper or lower limit of the channel. However, traders should remember about a flat market, which means that volatility may decrease as the holidays are approaching.
Indicators on charts:
Linear Regression Channels help identify the current trend. If both channels move in the same direction, the trend is strong.
Moving Average (20-day, smoothed) defines the short-term and current trends.
Murray levels are target levels for trends and corrections.
Volatility levels (red lines) reflect a possible price channel the pair is likely to trade in within the day based on the current volatility indicators.
CCI indicator: when the indicator is in the oversold area (below 250) or in the overbought area (above 250), it means that a trend reversal is likely to occur soon.